Determine the optimal value of K in KMeans Clustering ML (original) (raw)
Last Updated : 11 Jul, 2025
Clustering techniques use raw data to form clusters based on common factors among various data points. Choosing the right number of clusters (**K) in K-Means clustering is very important. If we choose the wrong value of K, the model may not find good patterns in the data. But selecting the best K manually is not easy.
So we use different techniques to find the optimal value of K. In this article we will learn these techniques.
Techniques to find Optimal value of k
**1. Elbow method
**Elbow method is a technique used to choose the best number of clusters for K-Means clustering. The basic idea is to see how the **inertia (cost) changes as we increase the number of clusters.
- Inertia is the sum of squared distances from each data point to the center of its assigned cluster. It tells us how well the points are grouped in their clusters. The smaller the inertia the better the clustering.
- We plot the inertia for different values of K i.e different numbers of clusters. As K increases the inertia decrease because more clusters allow data points to be closer to their cluster centers.
- The goal is to find the value of K where the decrease in inertia starts to slow down. This is like an "elbow" in the plot where the curve bends and flattens out. The number of clusters at this point is considered the optimal value for K.
It is widely used because it is simple to understand as we use visualization technique to see its "elbow structure". This structurer helps us to find its optimal value. Below we are using K=3 manually to see how elbow structure forms.
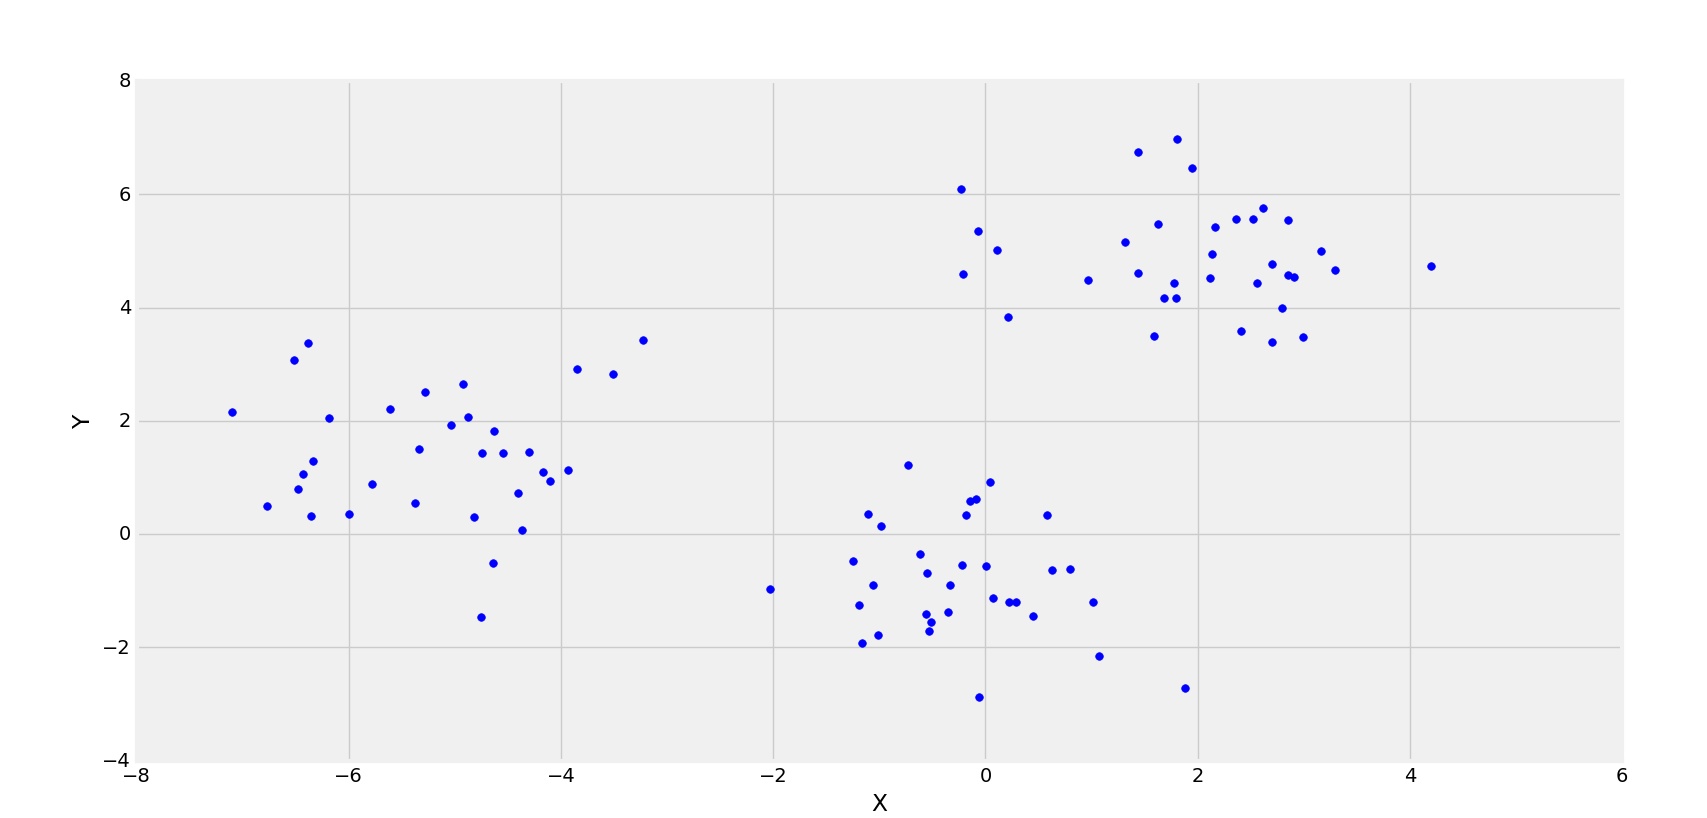
3 clusters are forming
In the above figure its clearly observed that the distribution of points are forming 3 clusters. Now let's see how elbow method forms its graph.
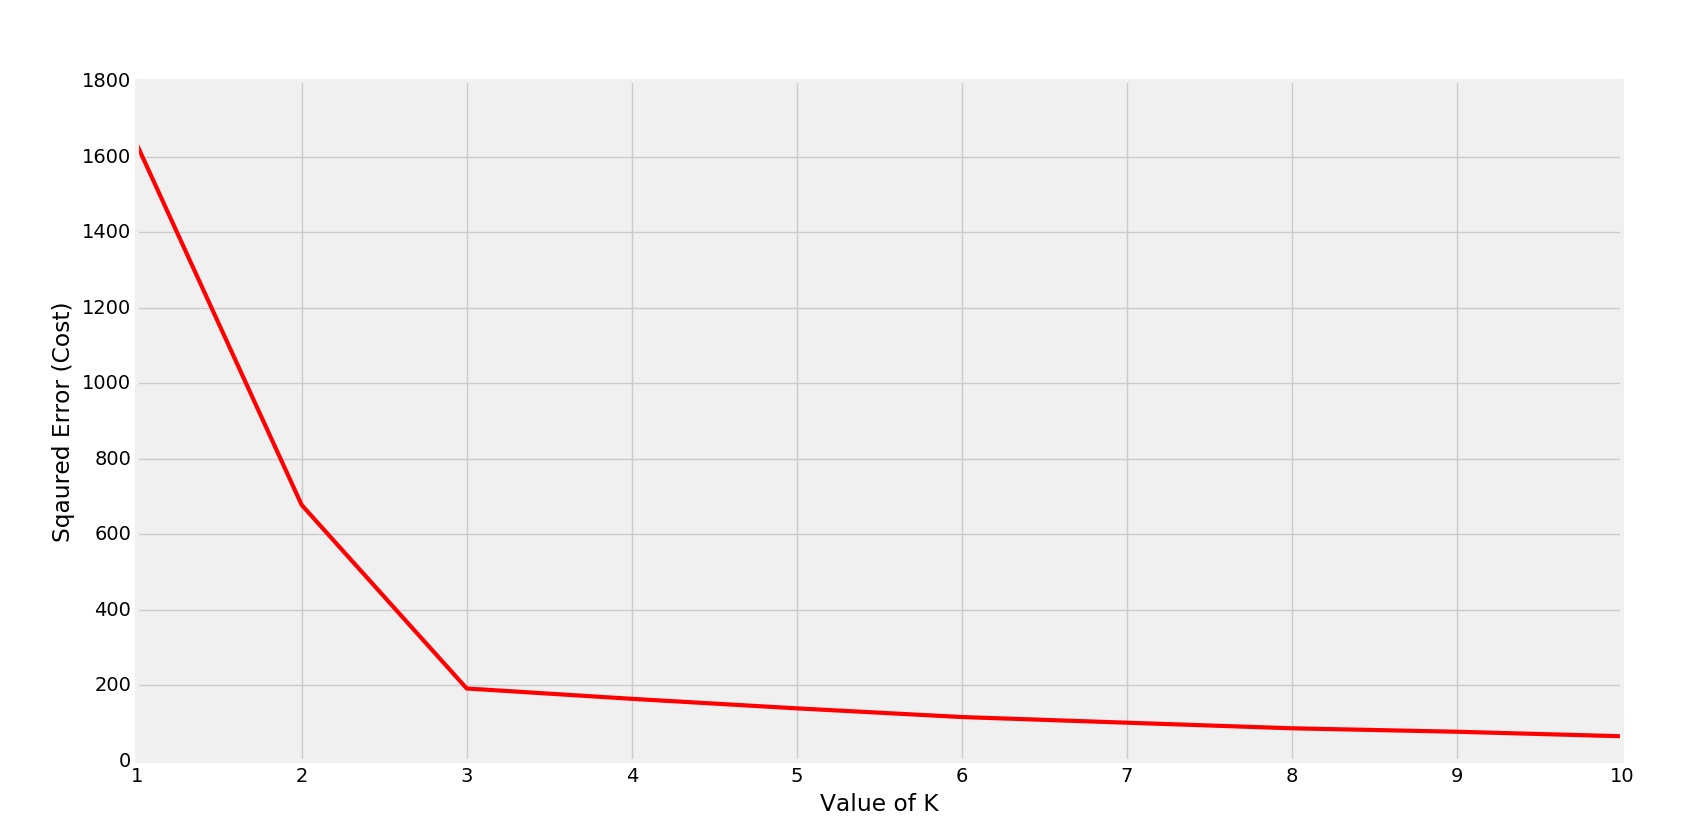
Elbow is forming at K=3
Clearly the elbow is forming at K=3. So the optimal value will be 3 for performing K-Means. Another example we will take with 4 clusters.
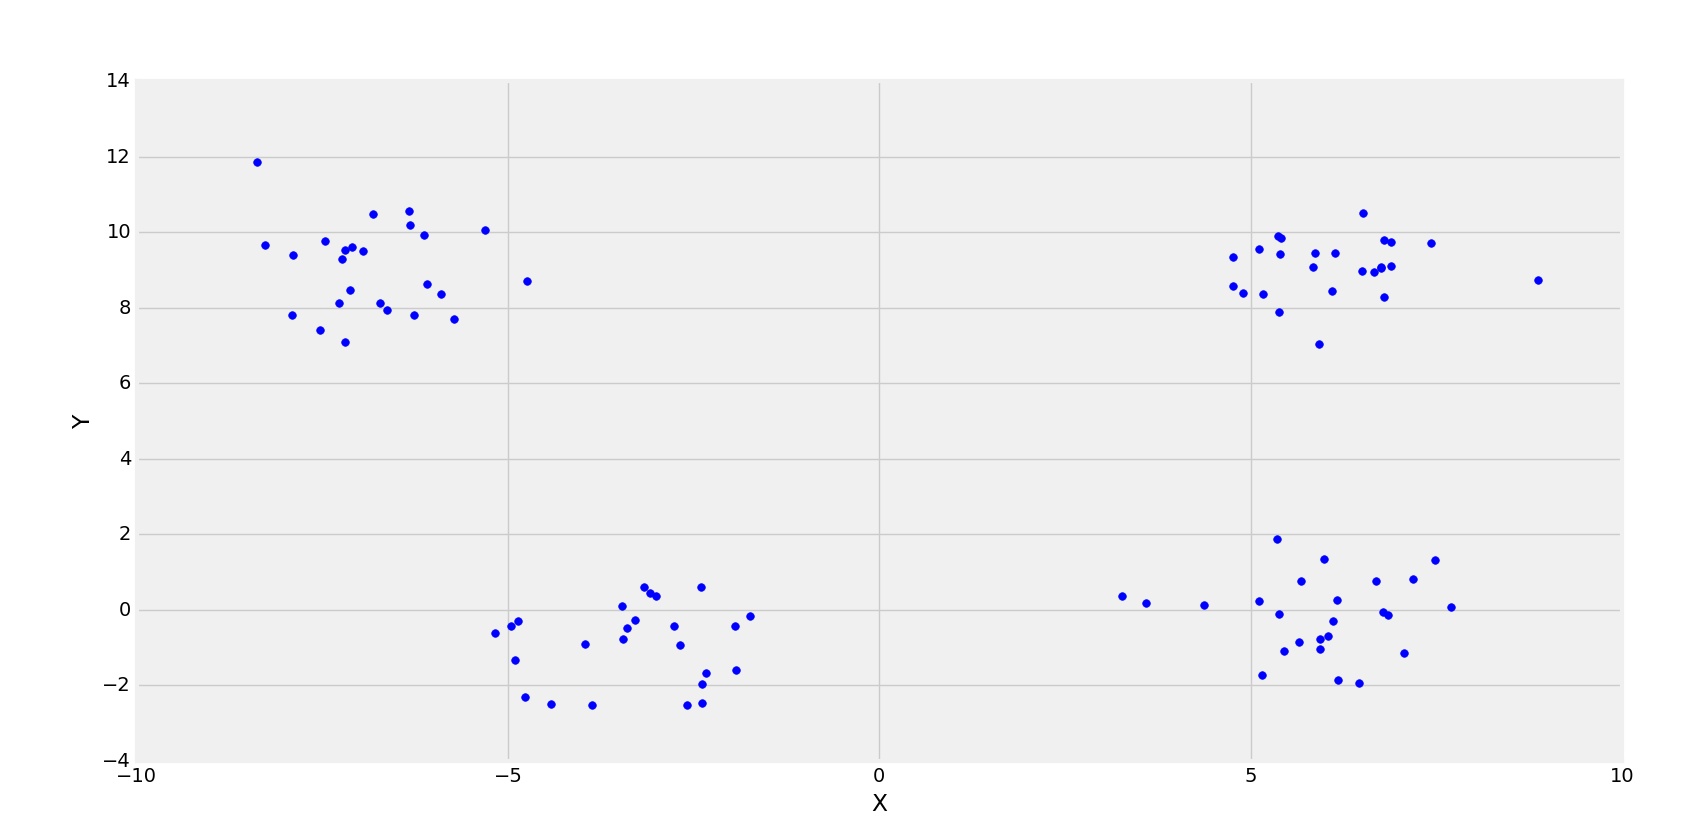
4-clusters
Corresponding Cost graph
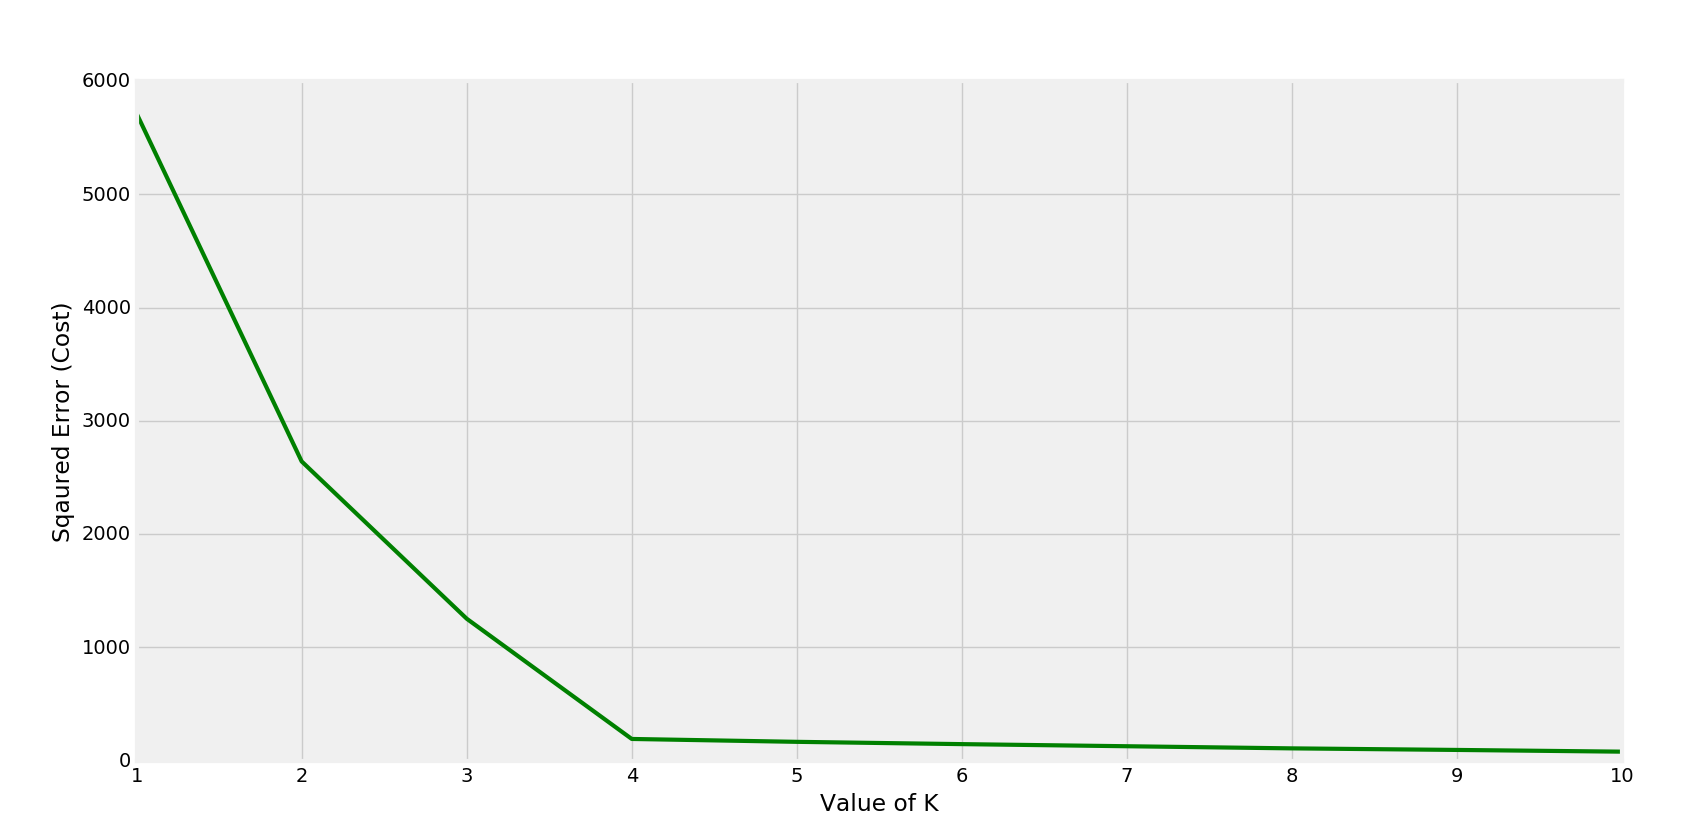
Elbow is forming at K=4
In this case the optimal value for k would be 4. Now that we have learned about elbow method we will now learn about other techniques.
**2. Silhouette Method
**Silhouette Method measures how similar each data point is to its own cluster compared to other clusters. It calculates a score for each point which tells us if the point is well-clustered. A higher score means the point is close to its own cluster and far from others. The Silhouette Score ranges from -1 to +1:
- ****+1** means the point is well-placed in its cluster.
- **0 means the point is on the boundary between clusters.
- **-1 means the point is in the wrong cluster.
We calculate the average Silhouette Score for different values of K. **The best K is the one with the highest average score indicating that the clusters are well-separated and each point is correctly grouped.
s(i) = \frac{b(i) - a(i)}{\max(a(i), b(i))}
Where:
- s(i) is the silhouette score for point iii.
- a(i) is the average distance from point iii to all other points in the same cluster (cohesion).
- b(i) is the average distance from point iii to all points in the nearest different cluster (separation).
**Cons:
- Can be computationally expensive for large datasets.
- May not work well if clusters are not spherical or have different densities.
**3. Gap Statistic
**Gap Statistic compares the clustering result with a randomly distributed data to determine how well the clustering structure fits the data.
- It measures the difference between the total within-cluster variation (inertia) of actual data and of random data.
- The idea is that the actual clustering should have much lower inertia compared to random data.
- **We compute the Gap Statistic for different K values. The optimal K is the one that maximizes the gap meaning that the clustering is significantly better than random clustering.
\text{Gap}(K) = \frac{1}{B} \sum_{b=1}^{B} \log(W_k^b) - \log(W_k)
Where:
- K is the number of clusters.
- W_k is the within-cluster sum of squares for the actual data with K clusters.
- W_k^b is the within-cluster sum of squares for the randomly generated data with K clusters.
- B is the number of random data sets used for comparison.
**Cons:
- Computationally expensive as it requires generating random datasets and running multiple K-Means clustering operations.
- May not perform well on very small datasets.
**4. Davies-Bouldin Index
**Davies-Bouldin Index evaluates how well-separated the clusters are by looking at the average similarity between each cluster and its most similar cluster.
- For each pair of clusters it computes the ratio of sum of within-cluster spread (how tight cluster is) to the distance between the clusters.
- A **lower DBI value means better clustering because it indicates that the clusters are compact and well-separated.
- We compute the DBI for different values of K and the best K is the one that gives the **lowest DBI.
DBI = \frac{1}{n} \sum_{i=1}^{n} \max_{j \neq i} \left( \frac{S_i + S_j}{d(c_i, c_j)} \right)
Where:
- n is the number of clusters.
- S_i is the average distance between all points in cluster i and the centroid of cluster i.
- d(c_i, c_j) is the distance between the centroids of clusters i and j.
- \max_{j \neq i} denotes the maximum value over all other clusters j (excluding i).
**Cons:
- It may not work well if the clusters are highly overlapping or if there's no clear structure in the data.
Key Takeaways
Now we see which method to use for different situation.
- **Elbow Method: Use this method when we have a general sense of data and want a quick visual way to estimate K.
- **Silhouette Method: Use this method when we want to evaluate how well-clustered our points are and how well separated clusters are.
- **Gap Statistic: Use this method when we want to compare our clustering to a random distribution to see if it is meaningful or not.
- **Davies-Bouldin Index: Use this method when we want to minimize the similarity between clusters and find the optimal value of K that maximizes the separation.
Since silhouette Method, gap statistics and Davies-Bouldin Index all includes mathematical formula they all require better understanding of these concepts so it is suggested to use elbow method for beginner as it gives a clear visualization of optimal value of k.