OPTICS Clustering ML (original) (raw)
Last Updated : 2 May, 2026
OPTICS (Ordering Points To Identify the Clustering Structure) is a density-based clustering algorithm similar to DBSCAN clustering. Unlike DBSCAN which struggles with varying densities. OPTICS does not directly assign clusters but instead creates a reachability plot which visually represents clusters. The key concepts in OPTICS are:
- Core Distance: The minimum distance needed for a point to be classified as a core point. If a point does not have enough nearby neighbours, its core distance is undefined.
- **Reachability Distance: It is a measure of how difficult it is to reach from one point to another. It is calculated as the larger core distance of the starting point and the actual point.
Understanding Reachability Plot
A reachability plot is a graph that helps visualize clustering structures. It shows the reachability distance of each point in the dataset. It makes it ordered way based on how OPTICS processes them. Here clusters appear as valleys in the plot where lower reachability distances indicate dense regions while peaks represent sparse regions or noise.
****,**To better understand the concept refer to the image below:
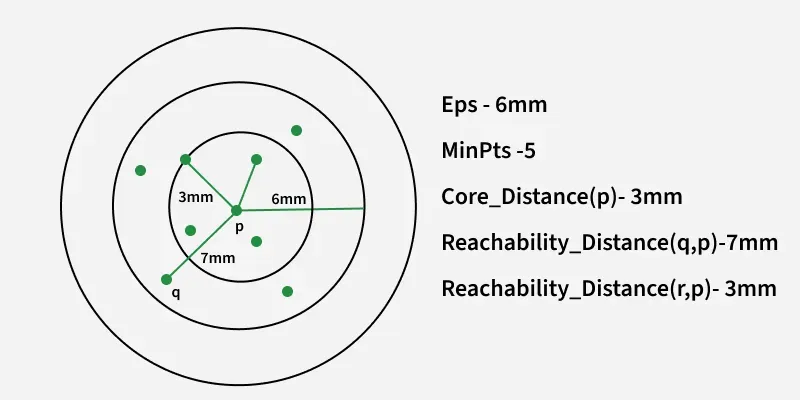
Core and Reachability Distances
- Epsilon (Eps) = 6mm and MinPts = 5.
- The core distance of point p is 3mm meaning it needs at least 5 points within a 3mm radius to be considered as a core point.
- The reachability distance from q to p is 7mm (since q is farther than p's core distance).
- The reachability distance from r to p is 3mm (since r is within p's core distance).
It is more informative than DBSCAN as the reachability plot provides better understanding of clustering structure. Now we will learn about its working.
Working of OPTICS
- The algorithm selects a starting point and checks if it has at least MinPts neighbors within Eps.
- If the point meets the density requirement it is marked as a core point and nearby points are then analyzed.
- Reachability distance is computed for each neighboring point.
- Points are then processed in order of their reachability distance hence forming a reachability plot.
- Clusters appear as valleys i.e low reachability distances and noise appears as peaks i.e high reachability distances.
Implementing
Below is the Python implementation using scikit-learn to demonstrate OPTICS on a synthetic dataset of varying densities:
- **OPTICS(min_samples=5, xi=0.05, min_cluster_size=0.05): Configures the OPTICS algorithm.
- **labels=clustering.labels_: Retrieves cluster labels.
- **plt.scatter(): Plots the clustering results. Python `
from sklearn.cluster import OPTICS from sklearn.datasets import make_blobs import numpy as np import matplotlib.pyplot as plt
X, _ = make_blobs(n_samples=300, centers=3, random_state=42)
clustering = OPTICS(min_samples=5, xi=0.05, min_cluster_size=0.05) clustering.fit(X)
labels = clustering.labels_
plt.scatter(X[:, 0], X[:, 1], c=labels, cmap='rainbow', edgecolor='k') plt.title("OPTICS Clustering on Synthetic Data") plt.xlabel("Feature 1") plt.ylabel("Feature 2") plt.show()
`
**Output:

OPTICS Clustering
OPTICS vs. DBSCAN Algorithm
| Feature | OPTICS | DBSCAN |
|---|---|---|
| Handles Varying Densities | Can detect clusters of different densities. | Struggles with varying densities as it requires a single epsilon value for all points. |
| Cluster Identificatio**n | Uses a reachability plot for cluster extraction and identifies hierarchical structures. | Directly assigns clusters without hierarchical structure. |
| Hierarchical Structure | Yes it can detect nested clusters. | No it does not support hierarchical clustering. |
| Runtime Complexity | Higher due to sorting and ordering of reachability distances. | Lower as it processes fewer calculations. |
| Memory Cost | Requires more memory as it maintains a priority queue (Min Heap) for reachability. | Lower memory usage. |
| Fewer Parameters | Less sensitive to the epsilon parameter and can work with a large max_eps, but still uses a neighborhood radius internally. | Requires careful tuning of epsilon and minPts parameters for effective clustering. |
| Noise Handling | Does not directly identify noise points but high reachability distances may indicate noise. | Directly identify core points, boundary points and noise points. |
| Cluster Extraction | Produces a reachability distance plot for flexible extraction at different granularities. | Assigns clusters directly based on density criteria without additional plots. |
OPTICS is widely used for clustering algorithm that works well for identifying clusters of varying densities. It provides flexibility through reachability plots which allows dynamic cluster extraction. While computationally more expensive it is useful for complex datasets where density variation is significant.