Tdistributed Stochastic Neighbor Embedding (tSNE) Algorithm ML (original) (raw)
T-distributed Stochastic Neighbor Embedding (t-SNE) Algorithm - ML
Last Updated : 2 May, 2026
T-distributed Stochastic Neighbor Embedding (t-SNE) is a non linear dimensionality reduction technique used for visualizing high-dimensional data in a lower-dimensional space mainly in 2D or 3D. Unlike linear methods such as Principal Component Analysis (PCA), t-SNE focus on preserving the local structure and pattern of the data.
- Dimensionality reduction is a process that simplifies complex dataset by combining similar or correlated features.
- It helps in improving analysis and computational efficiency.
- t-SNE works by looking at the similarity between data points in the high-dimensional space.
- The similarity is computed as a conditional probability. It calculates how likely it is that one data point would be near another.
**Implementation of t-SNE on MNIST Dataset
Now let's use the sklearn implementation of the t-SNE algorithm on the MNIST dataset which contains 10 classes that are for the 10 different digits in the mathematics.
Python `
import numpy as np import pandas as pd import seaborn as sn import matplotlib.pyplot as plt from sklearn.manifold import TSNE from sklearn.preprocessing import StandardScaler from sklearn.datasets import fetch_openml
`
Now let's load the MNIST dataset into pandas dataframe.
Python `
mnist = fetch_openml('mnist_784', version=1)
d = mnist.data
l = mnist.target
df = pd.DataFrame(d) df['label'] = l
print(df.head(4))
`
**Output:
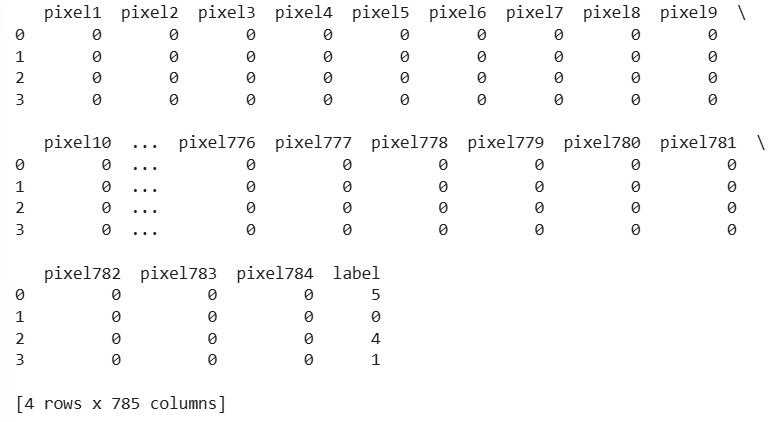
First five rows of the MNIST dataset
Before applying the t-SNE algorithm on the dataset we must standardize the data. As we know that the t-SNE algorithm is a complex algorithm which utilizes some complex non-linear methods.
Python `
from sklearn.preprocessing import StandardScaler
X = df.drop('label', axis=1) standardized_data = StandardScaler().fit_transform(X)
print(standardized_data.shape)
`
**Output:
(70000, 784)
Now let's reduce the 784 columns data to 2 dimensions so that we can create a scatter plot to visualize the same.
Python `
data_1000 = standardized_data[0:1000, :] labels_1000 = l[0:1000]
model = TSNE(n_components = 2, random_state = 0)
tsne_data = model.fit_transform(data_1000)
tsne_data = np.vstack((tsne_data.T, labels_1000)).T tsne_df = pd.DataFrame(data = tsne_data, columns =("Dim_1", "Dim_2", "label"))
sn.scatterplot(data=tsne_df, x='Dim_1', y='Dim_2', hue='label', palette="bright") plt.show()
`
**Output:

t-SNE
The scatter plot above shows how t-SNE has mapped the MNIST dataset into a 2D space. The points are grouped by digit and we can see that similar digits (like 1s or 7s) are clustered together making it easier to identify patterns and relationships in the data.
Advantages
- **Great for Visualization: t-SNE is particularly used to convert complex high-dimensional data into 2D or 3D for visualization making patterns and clusters easy to observe.
- **Preserve Local Structure: Unlike linear techniques like PCA, t-SNE focus on maintaining the local relationships between data points meaning similar data points remain close in the lower-dimensional space.
- **Non-Linear Capability: It captures non-linear dependencies in the data which makes it suitable for complex datasets where linear methods fail.
- **Cluster Separation: Helps in clearly visualizing clusters and class separability in datasets like MNIST making it easier for interpretation and exploration.
Disadvantages
- **Computationally Intensive: t-SNE is slower and more computationally expensive compared to linear methods especially on large datasets.
- **Non-deterministic Output: The output can vary with each run due to its randomness unless a fixed random_state is used.
- **Not Scalable for Large Datasets: It struggles with very large datasets (e.g., millions of points) unless optimized or approximated versions are used.
- **Not Good for Downstream Tasks: t-SNE is mainly for visualization and is not suitable for dimensionality reduction when feeding data into other ML algorithms.
- **No Global Structure Preservation: It may distort global distances and structures in the data focusing more on preserving local neighborhoods.