Difference between Parametric and NonParametric Models in Machine Learning (original) (raw)
Last Updated : 23 Jul, 2025
When it comes to statistical modeling and machine learning, parametric and non-parametric models represent two fundamental approaches, each with its strengths and suitability depending on the data and the problem at hand.
**In this article, we are going to explore parametric and non-parametric models along with the implementation and comparison between these models.
Table of Content
- Understanding Parametric Models
- Implementing Parametric Model in Python: Linear Model
- Non-Parametric Models
- Implementing Non-Parametric Model in Python: K-Nearest Neighbors Regression
- Key Differences between Parametric and Non- Parametric Models
- Choosing between Parametric and Non-Parametric Models
- Conclusion
Understanding Parametric Models
Parametric models make strong assumptions about the functional form, or shape, of the relationship between the variables in the data. These models are characterized by having a fixed number of parameters, which are estimated from the training data and used to make predictions.
Key Features of Parametric Models
- **Assumptions: They assume a specific form for the relationship between variables (e.g., linear regression assumes a linear relationship).
- **Parameterized: The model parameters are fixed in number and are typically estimated using techniques like maximum likelihood estimation or least squares.
- **Efficiency: Since they assume a specific form, parametric models are often computationally efficient and require fewer training data to estimate parameters compared to non-parametric models.
- **Interpretability: Parameters in parametric models often have straightforward interpretations, making them useful for inference and understanding the relationship between variables.
Examples of Parametric Models
- **Linear Regression****:** Assumes a linear relationship between the dependent and independent variables.
- **Logistic Regression****:** Assumes a linear relationship between the log-odds of the dependent variable and the independent variables.
Implementing Parametric Model in Python: Linear Model
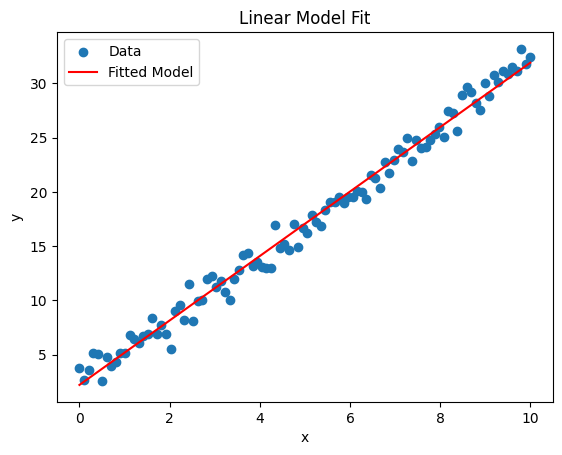
To create a parametric model in Python, you can use libraries such as scipy.optimize for fitting parameters to a given model. Below is an example of how to create a simple parametric model using Python, where we fit a linear model y=a⋅x+b to some data.
Python `
import numpy as np import matplotlib.pyplot as plt from scipy.optimize import curve_fit
Define the model function
def linear_model(x, a, b): return a * x + b
Generate some example data
np.random.seed(0) x_data = np.linspace(0, 10, 100) y_data = 3 * x_data + 2 + np.random.normal(size=x_data.size)
Fit the model to the data
params, covariance = curve_fit(linear_model, x_data, y_data)
Extract the parameters
a, b = params print(f"Fitted parameters: a = {a}, b = {b}")
Plot the data and the fitted model
plt.scatter(x_data, y_data, label='Data') plt.plot(x_data, linear_model(x_data, a, b), color='red', label='Fitted Model') plt.legend() plt.xlabel('x') plt.ylabel('y') plt.title('Linear Model Fit') plt.show()
`
**Output:
Fitted parameters: a = 2.970267312241292, b = 2.2084714396725103
Non-Parametric Models
Non-parametric models, in contrast, make fewer assumptions about the functional form of the relationship between variables. Instead of a fixed set of parameters, these models typically have parameters that grow with the size of the data, allowing them to be more flexible in modeling complex relationships.
Key Features of Non-Parametric Models
- **Flexibility: They do not assume a specific functional form, making them versatile in capturing complex patterns in data.
- **Parameterization: The number of parameters may vary with the size of the dataset, which can lead to increased computational complexity but greater flexibility.
- **Data Requirements: Non-parametric models often require larger amounts of data to estimate relationships accurately due to their flexibility.
- **Interpretability: They may offer less straightforward interpretations of parameters compared to parametric models, focusing more on predictive accuracy than on understanding the underlying relationships.
Examples of Non-Parametric Models
- **Decision Trees****:** Non-parametric model that splits data into branches based on features to predict outcomes.
- **K-Nearest Neighbors (KNN)****:** Non-parametric algorithm that makes predictions based on the closest training examples in the feature space.
Implementing Non-Parametric Model in Python: K-Nearest Neighbors Regression
Non-parametric models are flexible and make fewer assumptions about the form of the underlying relationship between the input and output variables. One common non-parametric method is the use of k-nearest neighbors (KNN) for regression. Below is an example using the KNeighborsRegressor from the **scikit-learn**library.
Python `
import numpy as np import matplotlib.pyplot as plt from sklearn.neighbors import KNeighborsRegressor from sklearn.model_selection import train_test_split
Generate some example data
np.random.seed(0) x = np.linspace(0, 10, 100).reshape(-1, 1) y = np.sin(x).ravel() + np.random.normal(0, 0.1, x.shape[0])
Split the data into training and testing sets
x_train, x_test, y_train, y_test = train_test_split(x, y, test_size=0.2, random_state=0)
Create the K-Nearest Neighbors regressor
knn = KNeighborsRegressor(n_neighbors=5)
Fit the model to the training data
knn.fit(x_train, y_train)
Predict on the testing data
y_pred = knn.predict(x_test)
Predict on a smooth curve for visualization
x_curve = np.linspace(0, 10, 1000).reshape(-1, 1) y_curve = knn.predict(x_curve)
Plot the data and the predictions
plt.scatter(x_train, y_train, label='Training Data', color='blue') plt.scatter(x_test, y_test, label='Testing Data', color='green') plt.plot(x_curve, y_curve, label='KNN Prediction', color='red') plt.legend() plt.xlabel('x') plt.ylabel('y') plt.title('K-Nearest Neighbors Regression') plt.show()
`
**Output:

Key Differences between Parametric and Non- Parametric Models
1. **Assumptions about Distribution
- **Parametric models involve significant assumptions about the form of the data distribution. For instance, they might assume that data are normally distributed, which simplifies the analysis but can lead to inaccuracies if the actual data distribution deviates from these assumptions.
- **Non-parametric models make few, if any, assumptions about the data's distribution. This flexibility allows them to adapt to the actual shape of the data, regardless of whether it conforms to any standard distribution.
2. **Model Flexibility
- **Parametric models are less flexible as they require the specification of a certain number of parameters defined by the underlying distribution assumptions. This can limit their ability to model complex or non-linear relationships effectively unless the correct functional form is known.
- **Non-parametric models are highly flexible because they do not assume a predetermined form for the model. They can model complex and nonlinear relationships more effectively because their structure is determined from the data.
3. **Interpretability
- **Parametric models are generally more interpretable because they provide a clear and specific mathematical form relating inputs to outputs. For example, the coefficients in a linear regression model directly describe the relationship between predictors and the response variable.
- **Non-parametric models, especially those that rely on advanced machine learning techniques like decision trees or neural networks, can be considered "black boxes" where it's harder to understand exactly how inputs are transformed into outputs.
4. **Data Requirements
- **Parametric models typically require fewer data to produce reliable results because the form of the model and its parameters compactly summarize the data. This makes them particularly useful in situations with limited data.
- **Non-parametric models often require large amounts of data to perform well since they must estimate the underlying distribution structure from the data itself without relying on predefined forms.
5. **Computational Complexity
- **Parametric models are usually simpler and faster to compute because they involve fewer parameters to estimate and use well-defined mathematical equations.
- **Non-parametric models can be computationally intensive as they may involve complex calculations or the use of algorithms that scale with the size of the data.
6. **Scope of Application
- **Parametric models are often used when a theoretical basis for the data distribution is known or when quick, straightforward predictions are needed.
- **Non-parametric models are preferable in exploratory settings where relationships between variables are unknown or when the data exhibits complex characteristics that parametric models cannot accurately capture.
Summary Table: Parametric Models vs. Non-Parametric Models
| Aspect | Parametric Models | Non-Parametric Models |
|---|---|---|
| Assumptions | Strong assumptions about data distribution and relationships (e.g., linear regression assumes linearity). | Fewer assumptions about data distribution and relationships. |
| Flexibility | Limited flexibility due to fixed functional form. | High flexibility to model complex relationships. |
| Interpretability | Parameters have clear interpretations. | Focus on predictive accuracy; parameters less interpretable. |
| Computational Efficiency | Generally more computationally efficient. | Can be computationally intensive with large datasets. |
| Data Requirements | Less data required for parameter estimation. | More data needed for accurate modeling of complex patterns. |
| Robustness | Vulnerable to model misspecification. | More robust to deviations from assumptions. |
| Overfitting Risk | Prone to underfitting complex data patterns. | Risk of overfitting if not properly regularized. |
| Training Time | Faster training time due to simpler estimation procedures. | Slower training time, especially with large datasets. |
| Application Areas | Well-suited for linear relationships and well-understood data. | Ideal for complex, nonlinear relationships and unknown data distributions. |
Choosing between Parametric and Non-Parametric Models
Choosing between parametric and non-parametric models in statistical modeling depends on several factors, including the structure of the data, the assumptions one is willing to make, and the goals of the analysis.
Here’s a rundown of when to use each type of model:
When to Use Parametric Models
- **Strong Assumptions About Data Distribution: Parametric models are appropriate when you can assume a specific form for the data distribution (e.g., normal distribution in linear regression). These assumptions simplify the model and increase its interpretability.
- **Limited Data: When data are scarce, parametric models can be more effective because they require fewer data points to estimate parameters, relying on the assumptions made about the data distribution.
- **Long-term Predictability: Due to their defined functional form, parametric models can be more stable for extrapolation outside the range of the observed data.
- **Simplicity and Speed: Parametric models often involve fewer computational resources and are generally faster to run, making them suitable for real-time applications and large datasets.
When to Use Non-Parametric Models
- **Weak or No Assumptions About Data Distribution: Non-parametric models are ideal when little is known about the underlying distribution of the data or when the data clearly violates the assumptions of parametric models (e.g., non-normal distributions).
- **Flexibility: These models are highly flexible as they do not assume a particular functional form. They can adapt to any shape of data, capturing complex relationships between variables.
- **High Variability in Data: Non-parametric models are better suited for handling data with high variability, outliers, or unusual distributions.
- **Interpretation of Complex Relationships: When the focus is on accurately modeling the relationship without necessarily understanding its nature (i.e., formulating a black-box model).
Conclusion
In summary, the choice between parametric and non-parametric models depends on the nature of the data, the complexity of the relationships, and the goals of the analysis. Parametric models are efficient and interpretable but make strong assumptions, while non-parametric models offer flexibility but may require more data and computational resources. Understanding these differences helps in selecting the appropriate model for a given problem in statistical modeling or machine learning.