SciPy Cluster (original) (raw)
Last Updated : 7 Jul, 2025
Clustering is the procedure of dividing the datasets into groups consisting of similar data points. In this procedure, the data points in the same group must be identical as possible and should be different from the other groups.
Types of SciPy - Cluster
There are two types of Cluster:
- **K-Means Clustering
- **Hierarchical Clustering
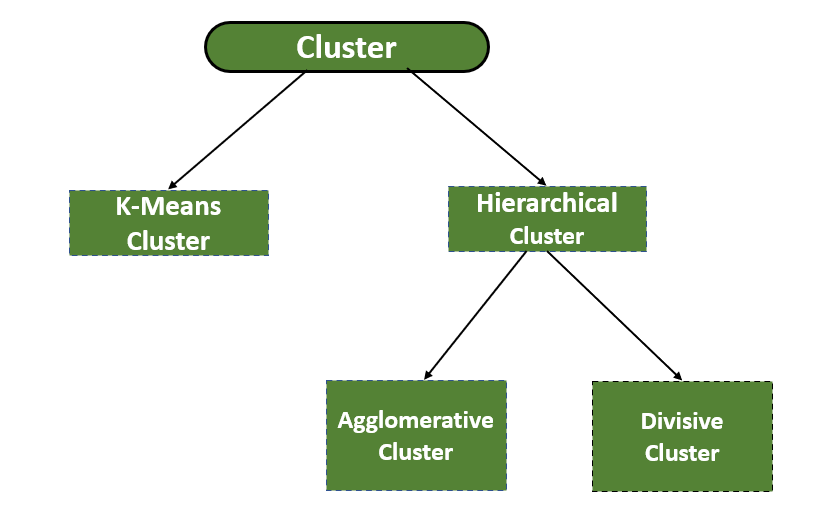
Types of clusters
**1. K-Means Clustering
To solve clustering problems in machine learning or data science an unsupervised algorithm is used that is the K-Means Clustering algorithm. This algorithm groups the unlabeled dataset into different clusters. Here K is the number of pre-defined clusters which is needed to be created in the process. In this algorithm, each cluster is associated with a centroid that’s why it is also known as a centroid-based algorithm.
Working of K-Means Clustering
- **Step 1: To decide the number of clusters first choose the number K.
- **Step 2: Consider random K points( also known as centroids).
- **Step 3: To form the predefined K clusters assign each data point to its closest centroid.
- **Step 4: Now find the mean and put a new centroid of each cluster.
- **Step 5: Reassign each datapoint to the new closest centroid of each cluster.
- **Step 6: If there comes any reassignment, then repeat **step 4.
Implementation using SciPy Module
Now we will see this algorithm in action by using the SciPy module implementation for the k-means clustering algorithm.
Python `
importing scipy packages for KMeans clustering.
from scipy.cluster.vq import kmeans import numpy as np import matplotlib.pyplot as plt from sklearn.datasets import make_blobs
generate dataset
dataset = make_blobs(n_samples=200, centers=4, n_features=2, cluster_std=1.6, random_state=50)
make dataset zero(0)
points = dataset[0]
create K-Means objects
model = kmeans(points, k_or_guess=4)
Now, a scatterplot of the datasets
plt.scatter(dataset[0][:, 0], dataset[0][:, 1])
`
**Output:
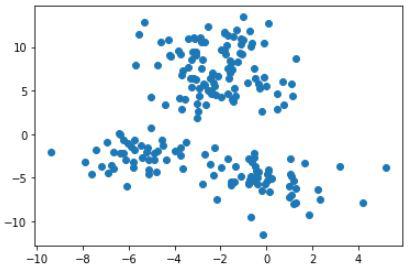
Scatter plot for the points used for clustering
Now, we will make an object of KMeans along with providing a number of clusters after that we can plot and visualize the cluster’s centers picked by k-means.
Python `
import seaborn as sb from scipy.cluster.vq import vq
creating variable
cluster_num = vq(points, centroids)[0]
scatter plot of K-Means cluster
sb.scatterplot(points[:, 0], points[:, 1], hue=cluster_num)
Centroid of the clusters
plt.scatter(centroids[:, 0], centroids[:, 1], marker='*', s=80, color='black')
`
**Output:
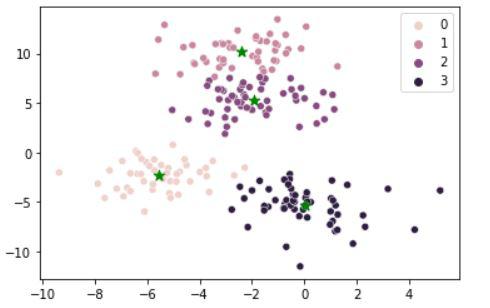
Points with their centroids and the cluster to which they belong
2. Hierarchical Cluster**ing**
It is another unsupervised Clustering algorithm that is used to group the unlabeled datasets into a cluster. The hierarchical Clustering algorithm develops the hierarchy of clusters in the form of a tree. This hierarchy of clusters which is in the form of a tree-shaped structure is known as the dendrogram.
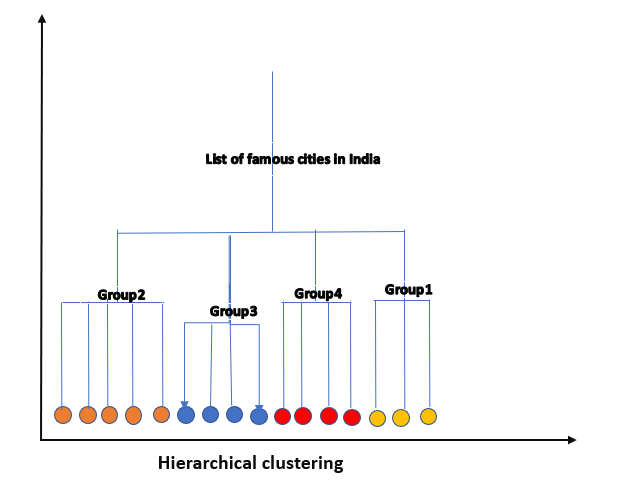
Hierarchical clustering dendogram
Implementation using SciPy Module
Now let's look at the code to implement the hierarchical clustering using the SciPy module.
Python `
importing scipy packages for hierarchical clustering.
import scipy.cluster.hierarchy as hc import numpy as np import matplotlib.pyplot as plt from sklearn.datasets import make_blobs from sklearn.cluster import AgglomerativeClustering
Create a blob of 200 data points
dataset = make_blobs(n_samples=200, centers=4, n_features=2, cluster_std=1.6, random_state=50)
make dataset zero(0)
points = dataset[0]
create a dendogram.
dendrogram = hc.dendrogram(hc.linkage(points, method='ward')) plt.axis('off')
`
**Output:
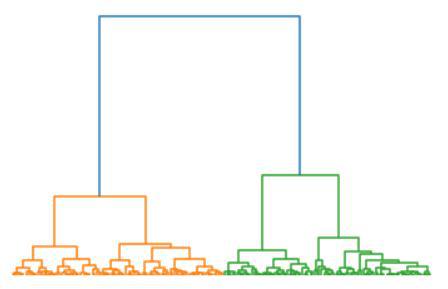
Hierarchical clustering output
Hierarchical clustering has two types:
- **Agglomerative Hierarchical clustering
- **Divisive Hierarchical clustering
2.1 Agglomerative Hierarchical clustering
In the hierarchical clustering algorithm, we don't have required a predefined number of clusters, it follows the **bottom-up approach to group the datasets into clusters. This algorithm considers each dataset as a single cluster at the beginning and then starts combining the closest pair of clusters together. This process is continued until all the clusters are merged into a single cluster.
**Working of the Agglomerative Hierarchical clustering
- **Step 1: Consider each data point as a single cluster. For example, suppose the number of data points is N so the number of clusters will also be N.
- **Step 2: Choose the two closest data points or clusters and merge them to make one cluster. Hence, now there will be N-1 clusters.
- **Step 3: Repeat **Step 2, until only one cluster is left.
- **Step 4: When all the clusters will be converted into one big cluster, then develop the dendrogram to divide the clusters as per the problem.
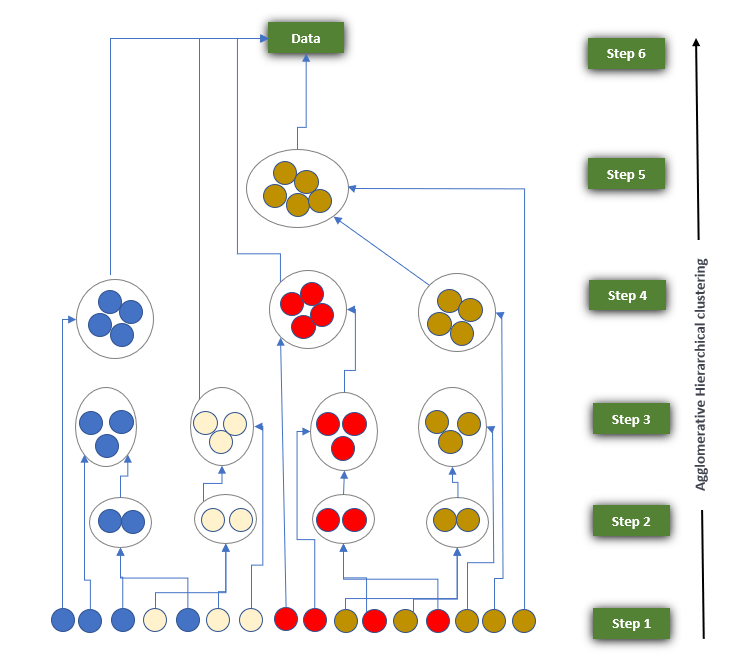
Working Algorithm for Agglomerative Hierarchical Clustering
2.2 Divisive hierarchical clustering
The working of Divisive hierarchical clustering is the same as Agglomerative Hierarchical clustering only difference is that it follows the **Top-down approach To group the datasets into clusters.
**Working Algorithm for Divisive Hierarchical Clustering
- **Step 1: Start with all data points in a single cluster.
- **Step 2: Select the cluster with the highest heterogeneity to split.
- **Step 3: Divide the selected cluster into two smaller clusters based on a dissimilarity measure.
- **Step 4: Repeat **Step 2 and **Step 3 until each data point becomes its own cluster or the desired number of clusters is reached.
- **Step 5: Create a dendrogram representing the splits to visualize the cluster hierarchy.
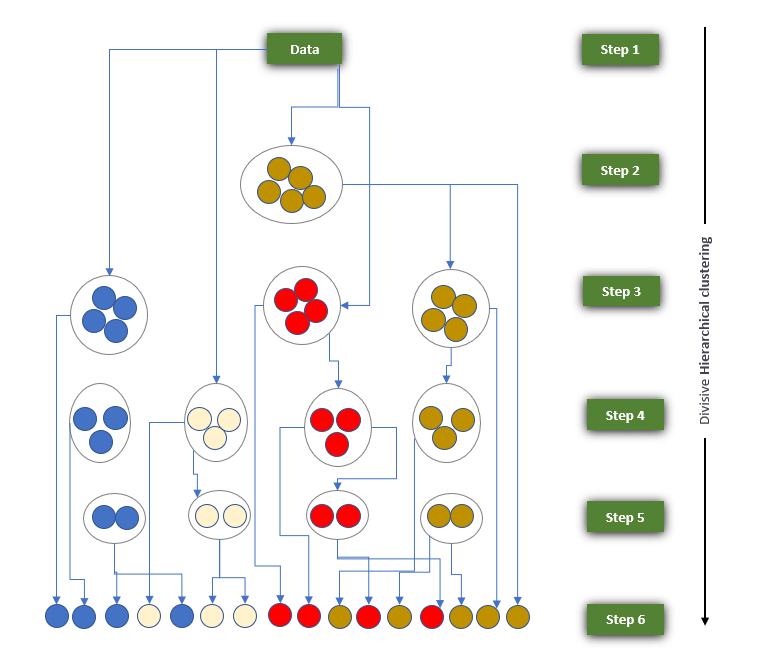
Working Algorithm for Divisive Hierarchical Clustering