Share Price Forecasting Using Facebook Prophet (original) (raw)
Last Updated : 17 Sep, 2024
Time series forecast can be used in a wide variety of applications such as Budget Forecasting, Stock Market Analysis, etc. But as useful it is also challenging to forecast the correct projections, Thus can't be easily automated because of the underlying assumptions and factors. The analysts who produced accurate forecasts are also rare, and there is a big market available for them because it requires a substantial understanding of statistics and data analysis and has prior experience of producing time series forecasting.
Facebook open-sourced its time-series forecasting tool called Prophet in 2017 which produced accurate forecasts as produced by skilled analysts with a minimum amount of human efforts. The Facebook prophet is available in the form of API in Python and R/
**How Prophet Works:
Facebook Prophet using Additive Regressive models using the following four components:
**y(t) = g(t) + s(t) + h(t) + \epsilon_t
- **g(t): A piecewise linear or logistic growth curve trend. Prophet automatically detects changes in trends by selecting change points from the data.
- **s(t): A yearly seasonal component modeled using the Fourier series and weekly seasonal component using dummy variable
- **h(t): A user-provided list of important holidays.
- **e t : Errorterm used by the prophet.
**Advantages of Facebook Prophet:
the prophet is optimized for business-related problems that are encountered at Facebook, it has the following characteristics:
- The Facebook prophet is as accurate as a skilled analyst and can generate results in seconds
- Facebook prophet requires minimal data processing and can deal with several outliers and null values.
- User can add seasonality and holidays values manually, this can help easily integrate the particular domain knowledge.
In this post, we will use Facebook prophet with Python. We try to forecast the share price of Amazon Stock (from 2019-2020) using the share price data from (2015-2019).
**Implementation:
- For this post, we will be using Amazon Stock Price data, it can be downloaded from yahoo finance website.
- First, we need to install the prophet tool, it can be installed with the following command in python. Python `
!pip install prophet
`
**Output
Requirement already satisfied: prophet in /usr/local/lib/python3.10/dist-packages (1.1.5) Requirement already satisfied: cmdstanpy>=1.0.4 in /usr/local/lib/python3.10/dist-packages (from prophet) (1.2.4) Requirement already satisfied: numpy>=1.15.4 in /usr/local/lib/python3.10/dist-packages (from prophet) (1.26.4) Requirement already satisfied: matplotlib>=2.0.0 in /usr/local/lib/python3.10/dist-packages (from prophet) (3.7.1) Requirement already satisfied: pandas>=1.0.4 in /usr/local/lib/python3.10/dist-packages (from prophet) (2.1.4) Requirement already satisfied: holidays>=0.25 in /usr/local/lib/python3.10/dist-packages (from prophet) (0.55) Requirement already satisfied: tqdm>=4.36.1 in /usr/local/lib/python3.10/dist-packages (from prophet) (4.66.5) Requirement already satisfied: importlib-resources in /usr/local/lib/python3.10/dist-packages (from prophet) (6.4.4) Requirement already satisfied: stanio<2.0.0,>=0.4.0 in /usr/local/lib/python3.10/dist-packages (from cmdstanpy>=1.0.4->prophet) (0.5.1) Requirement already satisfied: python-dateutil in /usr/local/lib/python3.10/dist-packages (from holidays>=0.25->prophet) (2.8.2) Requirement already satisfied: contourpy>=1.0.1 in /usr/local/lib/python3.10/dist-packages (from matplotlib>=2.0.0->prophet) (1.2.1) Requirement already satisfied: cycler>=0.10 in /usr/local/lib/python3.10/dist-packages (from matplotlib>=2.0.0->prophet) (0.12.1) Requirement already satisfied: fonttools>=4.22.0 in /usr/local/lib/python3.10/dist-packages (from matplotlib>=2.0.0->prophet) (4.53.1) Requirement already satisfied: kiwisolver>=1.0.1 in /usr/local/lib/python3.10/dist-packages (from matplotlib>=2.0.0->prophet) (1.4.5) Requirement already satisfied: packaging>=20.0 in /usr/local/lib/python3.10/dist-packages (from matplotlib>=2.0.0->prophet) (24.1) Requirement already satisfied: pillow>=6.2.0 in /usr/local/lib/python3.10/dist-packages (from matplotlib>=2.0.0->prophet) (9.4.0) Requirement already satisfied: pyparsing>=2.3.1 in /usr/local/lib/python3.10/dist-packages (from matplotlib>=2.0.0->prophet) (3.1.2) Requirement already satisfied: pytz>=2020.1 in /usr/local/lib/python3.10/dist-packages (from pandas>=1.0.4->prophet) (2024.1) Requirement already satisfied: tzdata>=2022.1 in /usr/local/lib/python3.10/dist-packages (from pandas>=1.0.4->prophet) (2024.1) Requirement already satisfied: six>=1.5 in /usr/local/lib/python3.10/dist-packages (from python-dateutil->holidays>=0.25->prophet) (1.16.0)
- Now, we need to import fbprophet and some other modules for data processing and plotting. We will use mean squared error and mean absolute error as our metrics.
**Code:
python `
import pandas as pd import numpy as np import matplotlib.pyplot as plt import prophet as fbp from sklearn.metrics import mean_squared_error, mean_absolute_error
Use fivethirtyeight plot style
plt.style.use('fivethirtyeight')
This code is modified by Susobhan Akhuli
`
- Now, we will read data from CSV file and put them into a pandas data frame.
**Code:
python `
We will be using amazon share price data which can be downloaded from YAHOO finance website.
df = pd.read_csv('sample_data / AMZN.csv') df.head()
`
**Output:
Date Open High Low Close Adj Close Volume0 2015-01-27 15.315000 15.5120 15.131500 15.337500 15.337500 58406000 1 2015-01-28 15.490500 15.5755 15.190000 15.195500 15.195500 61276000 2 2015-01-29 15.236500 15.6400 14.966500 15.589000 15.589000 173132000 3 2015-01-30 17.316000 17.9750 17.037001 17.726500 17.726500 477122000 4 2015-02-02 17.502501 18.2500 17.500500 18.223499 18.223499 204638000
- Since we need only two columns date and adjusted close price, so, we subset the original dataset to get these columns. Since the data is required in a prophet in the form of two columns named ds (for date column) and y (for data column).
**Code:
python `
add two columnsin dataframe having values as Date and Adj Close
df[['ds', 'y']] = df[['Date', 'Adj Close']]
Subset two columns from data frame
df = df[['ds', 'y']]
df.head()
`
**Output:
ds y0 2015-01-27 15.337500 1 2015-01-28 15.195500 2 2015-01-29 15.589000 3 2015-01-30 17.726500 4 2015-02-02 18.223499
- Now, we split the data frame into train and test data, we will be using 4 years of data for training and a year of data for test purpose.
**Code:
python `
split data frame into two parts train and test
split_date = "2019-07-21" df_train = df.loc[df.ds <= split_date].copy() df_test = df.loc[df.ds > split_date].copy()
`
- Now, we instantiate the Facebook prophet API, this prophet API works similar to scikit-learn. It uses the fit function to fit the dataset into the model and predict function to forecast future values.
**Code:
python `
Instantiate prophet
model = fbp.Prophet()
fit the training data
model.fit(df_train)
`
- Now, we use predict function to forecast the share price for next 1 year.
**Code:
python `
forecast = model.predict(df_test) forecast.tail()
`
**Output:
ds trend yhat_lower yhat_upper trend_lower trend_upper additive_terms additive_terms_lower additive_terms_upper weekly weekly_lower weekly_upper yearly yearly_lower yearly_upper multiplicative_terms multiplicative_terms_lower multiplicative_terms_upper yhat1006 2023-07-20 108.893908 -116.044847 344.478995 -126.995624 339.333334 7.124716 7.124716 7.124716 1.287964 1.287964 1.287964 5.836752 5.836752 5.836752 0.0 0.0 0.0 116.018624 1007 2023-07-21 108.906862 -122.813536 346.840552 -127.470630 339.659625 7.006898 7.006898 7.006898 1.132721 1.132721 1.132721 5.874177 5.874177 5.874177 0.0 0.0 0.0 115.913760 1008 2023-07-24 108.945726 -117.822491 346.984447 -127.919726 340.011825 6.951288 6.951288 6.951288 1.053084 1.053084 1.053084 5.898204 5.898204 5.898204 0.0 0.0 0.0 115.897014 1009 2023-07-25 108.958681 -119.359019 347.150753 -128.394731 340.338116 7.161561 7.161561 7.161561 1.282639 1.282639 1.282639 5.878922 5.878922 5.878922 0.0 0.0 0.0 116.120241 1010 2023-07-26 108.971635 -118.599240 347.492601 -128.869737 340.659261 7.144089 7.144089 7.144089 1.296344 1.296344 1.296344 5.847745 5.847745 5.847745 0.0 0.0 0.0 116.115724
- As we can see this column contains the date column, predict share price (y_hat), lower and upper estimates of it, trend components, seasonal components (weekly and yearly).
**Code:
python `
model.plot(forecast)
`
**Output:

forecast plot 1

forecast plot 2
- The command will plot the components of the prophet such as: trend line, weekly and yearly seasonality.
**Code:
python `
plot graphs of different components:
model.plot_components(forecast)
`
**Output:
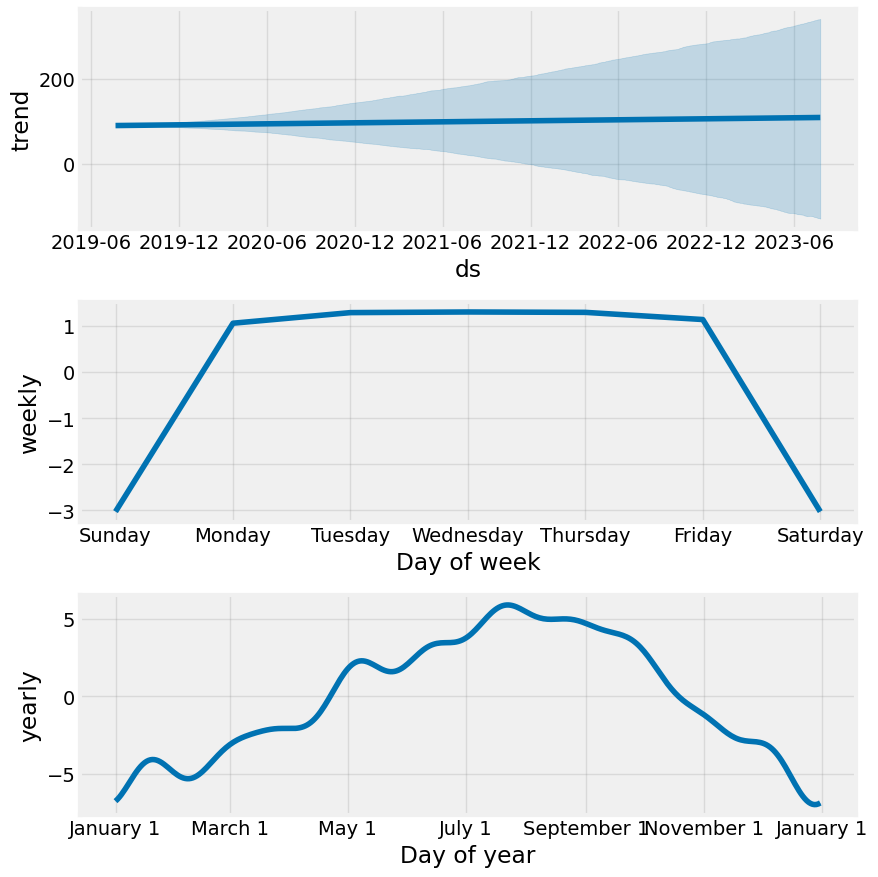
plotting graphs of different components

plotting graphs of different components
- Now, we calculate the mean square error and mean absolute error for the forecasted data.
**Code:
python `
code
print("Mean Squared Error (MSE):", mean_squared_error(y_true = df_test["y"], y_pred = forecast['yhat'])) print("Mean Absolute Error (MAE):", mean_absolute_error(y_true = df_test["y"], y_pred = forecast['yhat']))
`
**Output:
Mean Squared Error (MSE): 1928.5765426797855 Mean Absolute Error (MAE): 34.2779245809425
- Now, we calculate the mean absolute percentage error of our forecast, because it gives a better idea about how accurate our prediction is.
**Code:
python `
def mean_abs_perc_err(y_true, y_pred): return np.mean(np.abs((y_true - y_pred) / y_true)) * 100
print("Mean Absolute % Error (MAPE): ", mean_abs_perc_err(y_true = np.asarray(df_test["y"]), y_pred = np.asarray(forecast['yhat'])))
`
**Output:
Mean Absolute % Error (MAPE): 22.615631700798787
Get the Complete notebook:
**Notebook: **click here.
**Dataset: **click here.