Class 8 NCERT Solutions Chapter 15 Introduction to Graphs Exercise 15.2 (original) (raw)
Last Updated : 20 Sep, 2024
**Question 1: Plot the following points on a graph sheet. Verify if they lie on a line
****(a) A(4, 0), B(4, 2), C(4, 6), D(4, 2.5)**
**Solution:
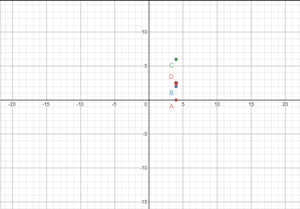
The points A(4, 0), B(4, 2), C(4, 6), D(4, 2.5) lie on a line and the line is parallel to Y-axis.
****(b) P(1, 1), Q(2, 2), R(3, 3), S(4, 4)**
**Solution:
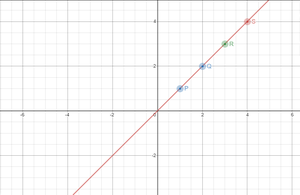
The points P(1, 1), Q(2, 2), R(3, 3), S(4, 4) lie on a line and the line is passing through origin.
****(c) K(2, 3), L(5, 3), M(5, 5), N(2, 5)**
**Solution:
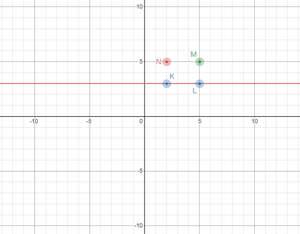
The points K(2, 3), L(5, 3), M(5, 5), N(2, 5) do not lie on a line.
**Question 2: Draw the line passing through (2, 3) and (3, 2). Find the coordinates of the points at which this line meets the x-axis and y-axis.
**Solution:
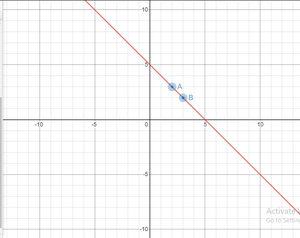
The line meets x-axis at (5, 0) and the line meets y-axis at (0, 5).
**Question 3: Write the coordinates of the vertices of each of these adjoining figures.
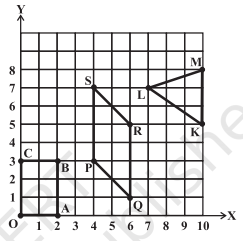
Coordinates of the vertices of the figure PQRS: P(4, 3), Q(6, 1), R(6, 5), S(4, 7).
Coordinates of the vertices of the figure OABC: O(0, 0), A(2, 0), B(2, 3), C(0, 3).
Coordinates of the vertices of the figure KLM: K(10, 5), L(7, 7), M(10, 8).
Exercise 15.2 in Chapter 15 of the Class 8 NCERT Mathematics textbook focuses on interpreting graphs and drawing conclusions from them. This exercise builds upon the basic concepts of plotting points and drawing line graphs introduced earlier in the chapter. Students will learn how to read and analyze various types of graphs, understand trends, and extract meaningful information from graphical representations of data.
**Question 4: State whether True or False. Correct that are false.
****(i) A point whose x coordinate is zero and y-coordinate is non-zero will lie on the y-axis.**
**Answer: True.
****(ii) A point whose y coordinate is zero and x-coordinate is 5 will lie on y-axis.**
**Answer: False.
**Correction: A point whose y coordinate is zero and x-coordinate is 5 will lie on x-axis.
****(iii) The coordinates of the origin are (0, 0).**
**Answer: True.
Summary
Chapter 15 of the Class 8 NCERT Mathematics textbook, titled "Introduction to Graphs," provides students with foundational knowledge about graphical representation of data. The chapter begins by introducing the Cartesian plane and the concept of coordinates, teaching students how to plot points on a graph. It then progresses to creating and interpreting line graphs, which are used to show how one quantity changes with respect to another. Students learn to draw graphs from given data and to read information from graphs. The chapter emphasizes the importance of scales in graphs and how to choose appropriate scales for different data sets. Through various examples and exercises, students develop skills in identifying trends, making comparisons, and drawing conclusions from graphical data. The chapter also touches on real-world applications of graphs in areas such as temperature records, population growth, and sales figures. By the end of the chapter, students should be able to confidently create, read, and interpret simple graphs, laying a strong foundation for more advanced data analysis and statistics in future studies. This knowledge is crucial in many fields, including science, economics, and social studies, where data visualization plays a key role in understanding and communicating information.