Class 8 NCERT Solutions Chapter 5 Data Handling Exercise 5.2 (original) (raw)
Last Updated : 15 Dec, 2020
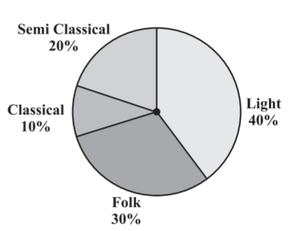
Problem 1. A survey was made to find the type of music that a certain group of young people liked in a city. The adjoining pie chart shows the findings of this survey. From this pie chart answer the following:
- If 20 people liked classical music, how many young people were surveyed?
- Which type of music is liked by the maximum number of people?
- If a cassette company were to make 1000 CD’s, how many of each type would they make?
Solution:
(i) Given, 20 people liked classical music. From the pie chart, we can see that classical music is liked by 10% of young people in the city. Let the total number of people in the city = x
Given, 10% of x = 20
(10/100) * x = 20
x = (20 * 100) / 10 = 200
So, 200 young people were surveyed.
(ii) Since light music occupies a maximum percentage (40%) in the pie chart, it is liked by the maximum number of people.
(iii) If a cassette company were to make 1000 CD’s, they would make
Classical music CDs = 10% of 1000
= (10 / 100) * 1000
= 100 CDs
Semi Classical music CDs = 20% of 1000
= (20 / 100) * 1000
= 200 CDs
Folk music CDs = 30% of 1000
= (30 / 100) * 1000
= 300 CDs
Light music CDs = 40% of 1000
= (40 / 100) * 1000
= 400 CDs
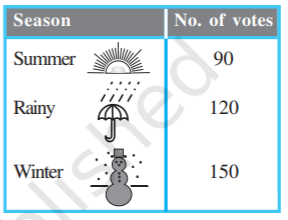
Problem 2. A group of 360 people was asked to vote for their favorite season from the three seasons rainy, winter, and summer.
- Which season got the most votes?
- Find the central angle of each sector.
- Draw a pie chart to show this information.
Solution:
(i) Winter season got the most votes (150).
(ii) Find the proportion and percentage of each sector to calculate the central angle of each sector.
Total votes = 90 + 120 + 150 = 360
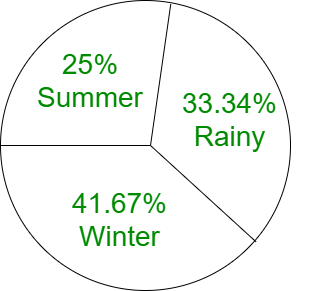
Proportion of summer season = 90 / 360 = 1 / 4, Percentage = (1 / 4) * 100 = 25%
Proportion of rainy season = 120 / 360 = 1 / 3, Percentage = (1 / 3) * 100 = 33.334%
Proportion of winter season = 150 / 360 = 5 / 12, Percentage = (5 / 12) * 100 = 41.667%
Now, the central angle of each sector is,
Summer season = (25 / 100) * 360° = 90°
Rainy season = (33.334 / 100) * 360° = 120°
Winter season = (41.667 / 100) * 360° = 150°
(iii) Pie Chart:
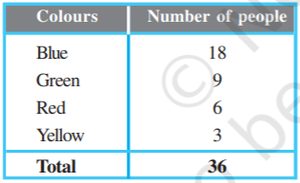
Problem 3. Draw a pie chart showing the following information. The table shows the colors preferred by a group of people.
Solution:
Find the proportion and percentage of each sector to calculate the central angle of each sector.
Total number of people = 18 + 9 + 6 + 3 = 36
Proportion of Blue = 18 / 36 = 1 / 2, Percentage = (1 / 2) * 100 = 50%
Proportion of Green = 9 / 36 = 1 / 4, Percentage = (1 / 4) * 100 = 25%
Proportion of Red = 6 / 36 = 1 / 6, Percentage = (1 / 6) * 100 = 16.667%
Proportion of Yellow = 3 / 36 = 1 / 12, Percentage = (1 / 12) * 100 = 8.334%
Now, the central angle of each sector is,
Blue = (50 / 100) * 360° = 180°
Green= (41.667 / 100) * 360° = 90°
Red = (16.667 / 100) * 360° = 60°
Yellow = (8.334 / 100) * 360° = 30°
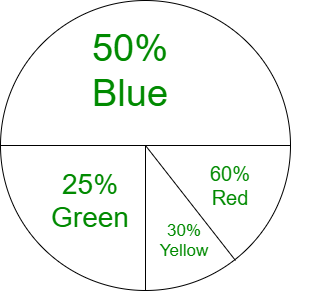
Pie Chart:
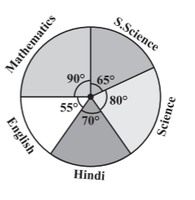
Problem 4. The adjoining pie chart gives the marks scored in an examination by a student in Hindi, English, Mathematics, Social Science, and Science. If the total marks obtained by the students were 540, answer the following questions.
- In which subject did the student score 105 marks?
- How many more marks were obtained by the student in Mathematics than in Hindi?
- Examine whether the sum of the marks obtained in Social Science and Mathematics is more than that in Science and Hindi.
Solution:
(i) Given, total marks obtained by the students were 540, So,
For 540 marks, the central angle = 360°
For 1 mark, the central angle = (360 / 540)°
For 105 marks, the central angle = ((360 / 540) * 105)°
= 70°
From the given pie chart, 70° corresponds to Hindi language. Therefore, the student score 105 marks in Hindi.
(ii) In mathematics, marks scored = (90 / 360) * 540
= 135 marks
In hindi, marks scored = (70 / 360) * 540
= 105 marks
Therefore, the student scored (135 - 105) = 30 marks more in Mathematics than in Hindi.
(iii) In mathematics, marks scored = 135 marks
In hindi, marks scored = 105 marks
In social science, marks scored = (65 / 360) * 540
= 97.5 marks
In science, marks scored = (80 / 360) * 540
= 120 marks
Marks in social science + mathematics = 97.5 + 135 = 232.5
Marks in science + hindi = 120 + 105 = 225
232.5 > 225
Yes, the sum of the marks obtained in Social Science and Mathematics is more than that in Science and Hindi.
Alternative way:
Central angle of social science + mathematics = 65° + 90° = 155°
Central angle of science + hindi = 80° + 70° = 150°
155° > 150°
Yes, the sum of the marks obtained in Social Science and Mathematics is more than that in Science and Hindi.
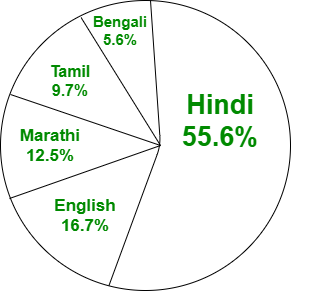
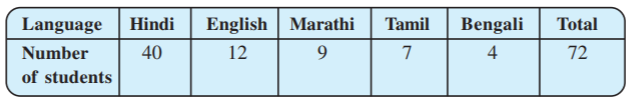
Problem 5. The number of students in a hostel, speaking different languages is given below. Display the data in a pie chart.
Solution:
Find the proportion and percentage of each sector to calculate the central angle of each sector.
Total number of students = 72
Proportion of Hindi = 40 / 72 = 5 / 9, Percentage = (5 / 9) * 100 = 55.556%
Proportion of English = 12 / 72 = 1 / 6, Percentage = (1 / 6) * 100 = 16.667%
Proportion of Marathi = 9 / 72 = 1 / 8, Percentage = (1 / 8) * 100 = 12.5%
Proportion of Tamil = 7 / 72 = 7 / 72, Percentage = (7 / 72) * 100 = 9.723%
Proportion of Bengali = 4 / 72 = 1 / 18, Percentage = (1 / 18) * 100 = 5.556%
Now, the central angle of each sector is,
Hindi = (55.556 / 100) * 360° = 200°
English = (16.667 / 100) * 360° = 60°
Marathi = (12.5 / 100) * 360° = 45°
Tamil = (9.723 / 100) * 360° = 35°
Bengali = (5.556 / 100) * 360° = 20°
Pie Chart: