Class 8 RD Sharma Solutions Chapter 27 Introduction to Graphs Exercise 27.2 (original) (raw)
Last Updated : 16 Sep, 2024
Exercise 27.2 from Chapter 27 "Introduction to Graphs" in RD Sharma's Class 8 mathematics textbook focuses on understanding and applying the concepts of graphs. This exercise typically covers topics such as plotting points on a coordinate plane, identifying coordinates of given points, and understanding the relationship between x and y coordinates.
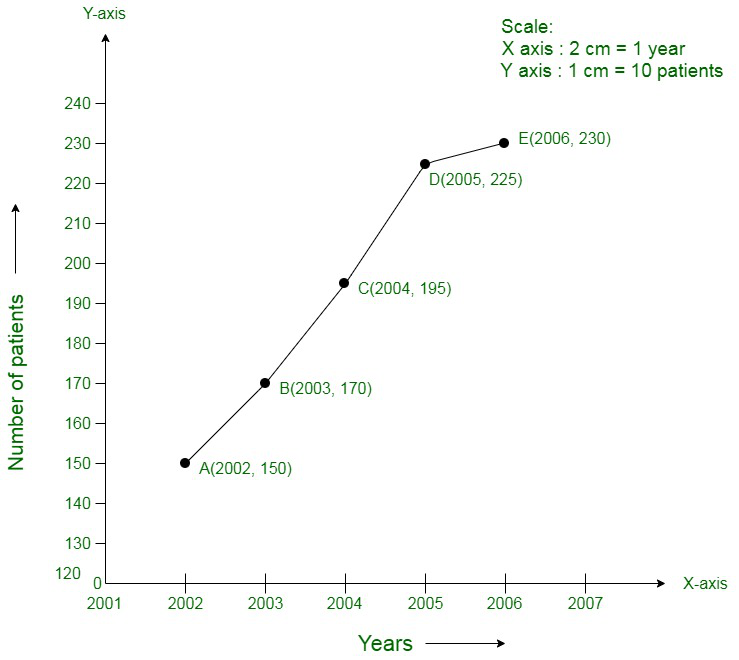
**Question 1. The following table shows the number of patients discharged from a hospital with HIV diagnosis in different years:
| **Years | **2002 | **2003 | **2004 | **2005 | **2006 |
|---|---|---|---|---|---|
| **Number of Patients | **150 | **170 | **195 | **225 | **230 |
**Represent the information by a graph.
**Solution:
From the question as we know that,
The number of patients - is a dependent variable.
Year - is an independent variable.
Take years on x-axis
and Number of patients on y - axis
Choose the following scale:
X - axis: 2 cm = 1 year
Y - axis: 1 cm = 10 patients
Consider that on the x-axis, origin (O) represents 2001 and on the y-axis, origin (O) represents 120,
i.e. O (2001, 120).
Now, Plot
(2002, 150),
(2003, 170),
(2004, 195),
(2005, 225),
(2006, 230).
Join these points in the following graph as shown below.
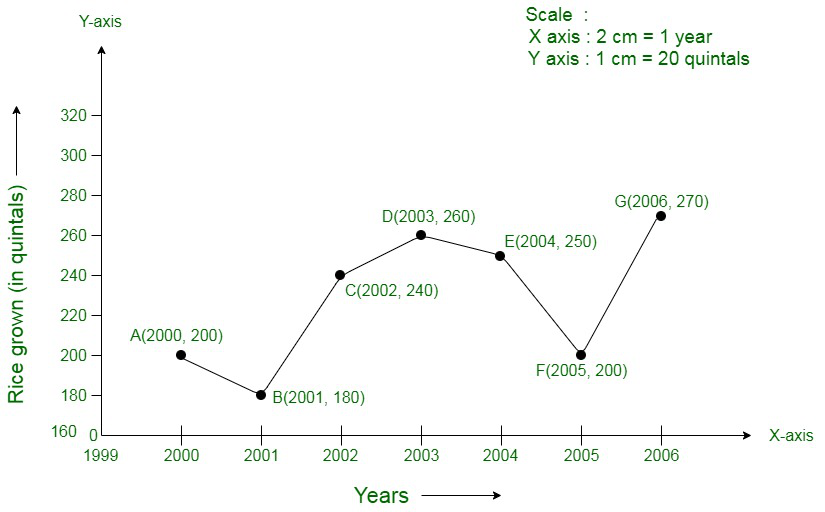
**Question 2. The following table shows the amount of rice grown by a farmer in different years:
| **Years | **2000 | **2001 | **2002 | **2003 | **2004 | **2005 | **2006 |
|---|---|---|---|---|---|---|---|
| **Rice grown (in quintals) | **200 | **180 | **240 | **260 | **250 | **200 | **270 |
**Plot a graph to illustrate this information.
**Solution:
From the question as we know that,
Year - is an independent variable
Quantity of rice grown is a dependent variable.
So, take
Year on X - axis
Quantity of rice grown on Y - axis
Choose following scale:
X - axis: 2 cm = 1 year
Y - axis: 1 cm = 20 quintals
Consider that the origin O represents the coordinates (1999, 160).
i.e. O (1999,160)
Now, Plot
(2000, 200),
(2001, 180),
(2002, 240),
(2003, 260),
(2004, 250),
(2005, 200),
(2006, 270).
Join these points on the following graph as shown below:
**Question 3. **The following table gives the information regarding the number of persons employed to a piece of work and time taken to complete the work:
| **Number of persons | **2 | **4 | **6 | **8 |
|---|---|---|---|---|
| **Time taken (in days) | **12 | **6 | **4 | **3 |
**Plot the graph of this information.
**Solution:
From the question as we know that,
The number of persons - is an independent variable
Time taken - is a dependent variable.
So, take
The number of persons on the X - axis
Time taken on the Y - axis.
Choose following scale:
X - axis: 2 cm = 2 persons
Y - axis: 2 cm = 2 days
Now, plot
(2, 12),
(4, 6),
(6, 4),
(8, 3).
Join these points on the following graph as shown below:

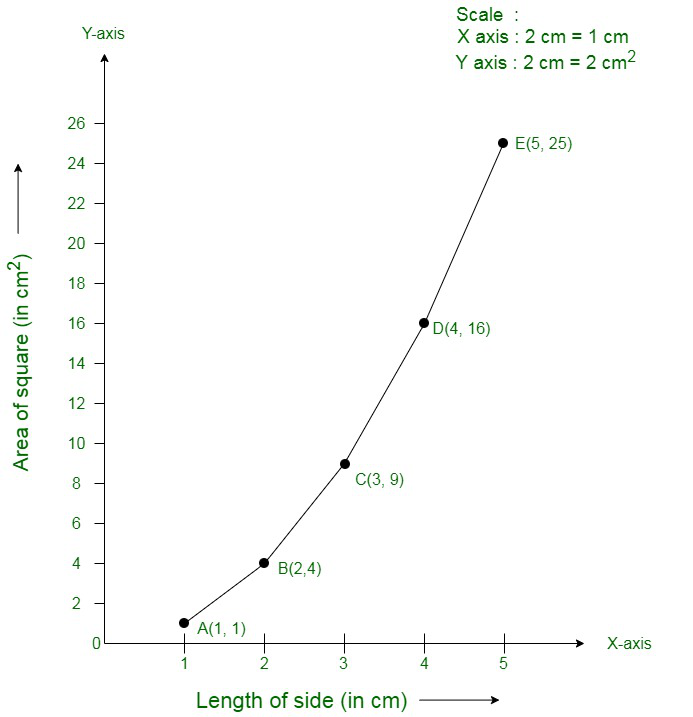
**Question 4. The following table gives the information regarding length of a side of a square and its area
| **Length of a side (in cm) | **1 | **2 | **3 | **4 | **5 |
|---|---|---|---|---|---|
| **Area of square (in cm 2 ) | **1 | **4 | **9 | **16 | **25 |
**Draw a graph to illustrate this information.
**Solution:
From the question as we know that,
Length of a side - is an independent variable
Area of the square - is a dependent variable.
So, take
Length of a side on the X - axis
Area of the square on the Y - axis.
Choose following scale:
X - axis: 2 cm = 1 cm
Y - axis: 1 cm = 2 cm2
Now, plot
(1, 1),
(2, 4),
(3, 9),
(4, 16),
(5, 25).
Join these points in the following graph as shown below:
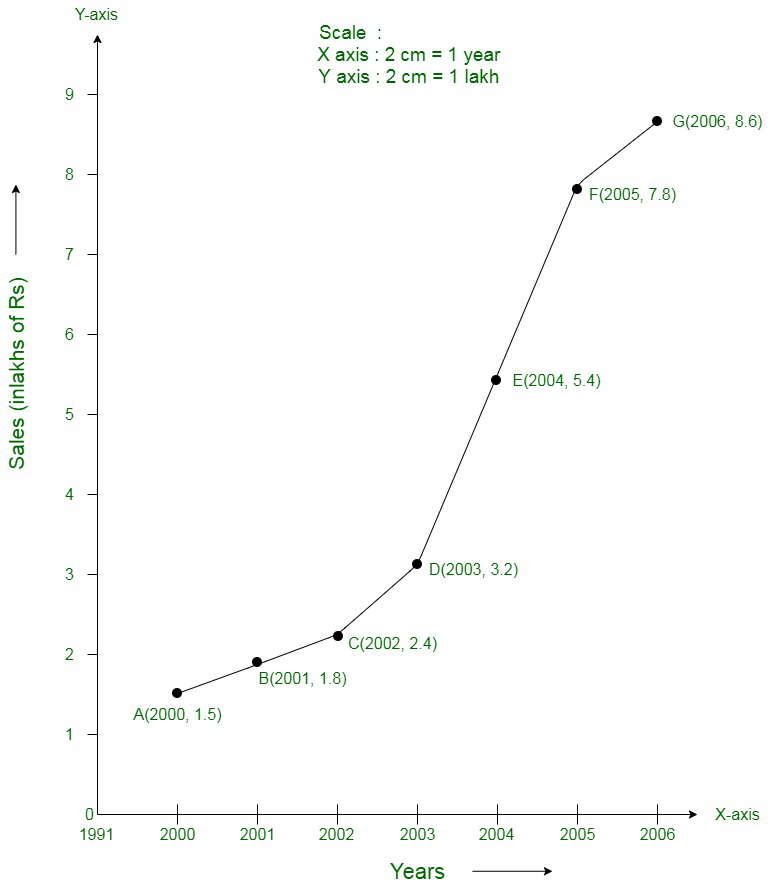
**Question 5. The following table shows the sales of a commodity during the years 2000 to 2006.
| **Years | **2000 | **2001 | **2002 | **2003 | **2004 | **2005 | **2006 |
|---|---|---|---|---|---|---|---|
| **Sales (in lakhs of Rs) | **1.5 | **1.8 | **2.4 | **3.2 | **5.4 | **7.8 | **8.6 |
**Draw a graph of this information.
**Solution:
From the question as we know that,
Year - is an independent variable
Sales - is a dependent variable.
So, take
Year on the X - axis
Sales on the Y - axis.
Choose following scale:
X - axis: 2 cm = 1 year
Y - axis: 2 cm = 1 lakh rupees
Consider that on x-axis, origin (O) represents 1991.
Hence, the coordinates of O are (1991, 0).
Now, plot
(2000, 1.5),
(2001, 1.8),
(2002, 2.4),
(2003, 3.2),
(2004, 5.4),
(2005, 7.8)
(2006, 8.6).
Join these points on the following graph as shown below;
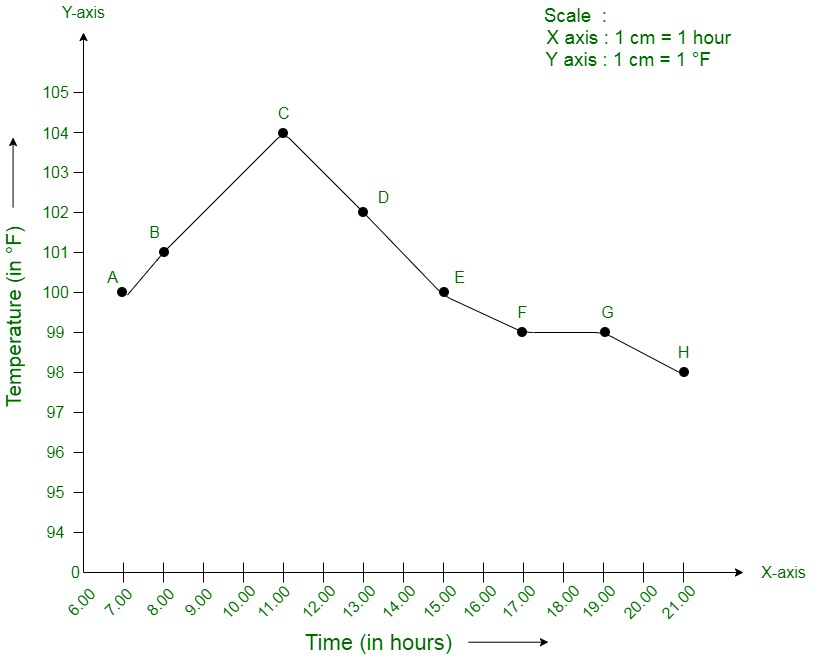
**Question 6. Draw the temperature-time graph in each of the following cases:
****(i)**
| **Time (in hours) | **7:00 | **9:00 | **11:00 | **13:00 | **15:00 | **17:00 | **19:00 | **21:00 |
|---|---|---|---|---|---|---|---|---|
| **Temperature (in **o F) | **100 | **101 | **104 | **102 | **100 | **99 | **100 | **98 |
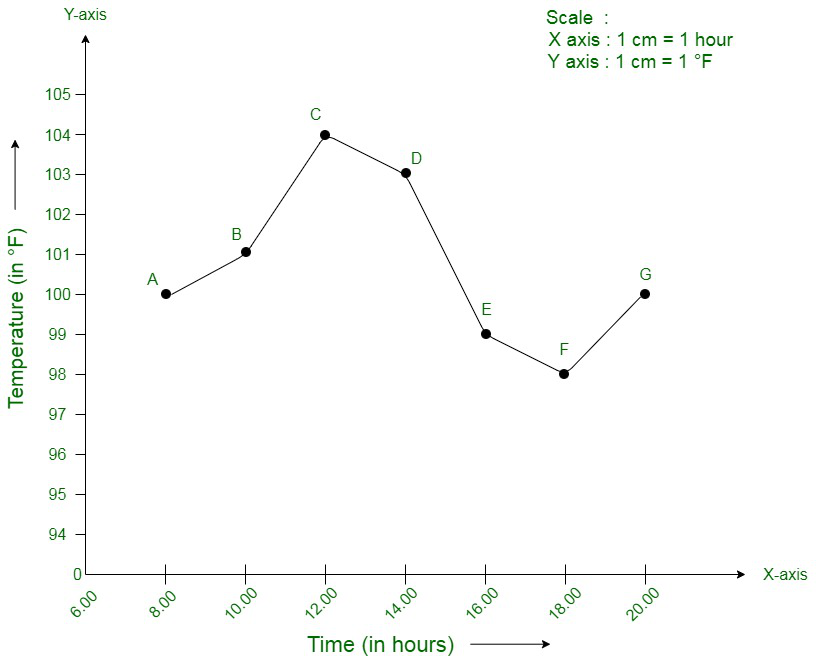
****(ii)**
| **Time (in hours) | **8:00 | **10:00 | **12:00 | **14:00 | **16:00 | **18:00 | **20:00 |
|---|---|---|---|---|---|---|---|
| **Temperature (in **o F) | **100 | **101 | **104 | **103 | **99 | **98 | **100 |
**Solution:
****(i)** From the question as we know that,
Time - is an independent variable
Temperature - is a dependent variable.
So, take
Time on the X - axis
Temperature on the Y - axis.
Choose following scale:
X - axis: 1 cm = 1 hour
Y - axis: 1 cm = 1°F
Consider that on the x-axis, the coordinate of origin is 6:00.
On y-axis, the coordinate of origin is 94°F.
Hence, the coordinates of 0 are (6:00, 94).
Now, plot
(7:00, 100),
(9:00, 101),
(11:00, 104)
(21:00, 98)
Join these points on the following graph as shown below:
****(ii)** From the question we know that,
Time - is an independent variable
Temperature - is a dependent variable.
So, take
Time on the X - axis
Temperature on the Y - axis.
Choose following scale:
X - axis: 2 cm = 2 hours
Y - axis: 1 cm = 1°F
Consider that on the x-axis, the coordinate of origin is 6:00.
On y-axis, the coordinate of origin is 94°F.
Thus, the coordinates of 0 are (6:00, 94).
Now, plot
(8:00, 100),
(10:00, 101),
(12:00, 104)…..
(20:00, 100).
Join these points on the graph as shown below:
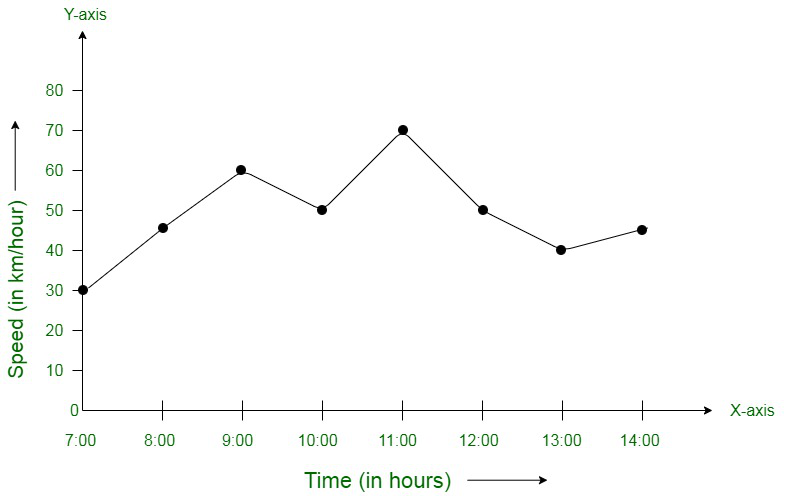
**Question 7. Draw the velocity-time graph from the following data:
| **Time (in hours) | **7:00 | **8:00 | **9:00 | **10:00 | **11:00 | **12:00 | **13:00 | **14:00 |
|---|---|---|---|---|---|---|---|---|
| **Speed (in km/hr) | **30 | **45 | **60 | **50 | **70 | **50 | **40 | **45 |
**Solution:
From the question as we know that,
Time - is an independent variable.
Speed - is a dependent variable.
So, take
Time on the X - axis
Speed on the Y - axis.
Choose following scale:
X - axis: 2 big division = 1 hour
Y - axis: 1 big division = 10 km/hr
Consider that on the x-axis, the coordinate of origin (O) is 7:00.
Thus, the coordinates of O are (7:00, 0).
Now, plot
(7:00, 30),
(8:00, 45),
(9:00, 60),
(10:00, 50),
(11:00, 70),
(12:00, 50),
(13:00, 40),
(14:00, 45).
Join these points on the graph as shown below:
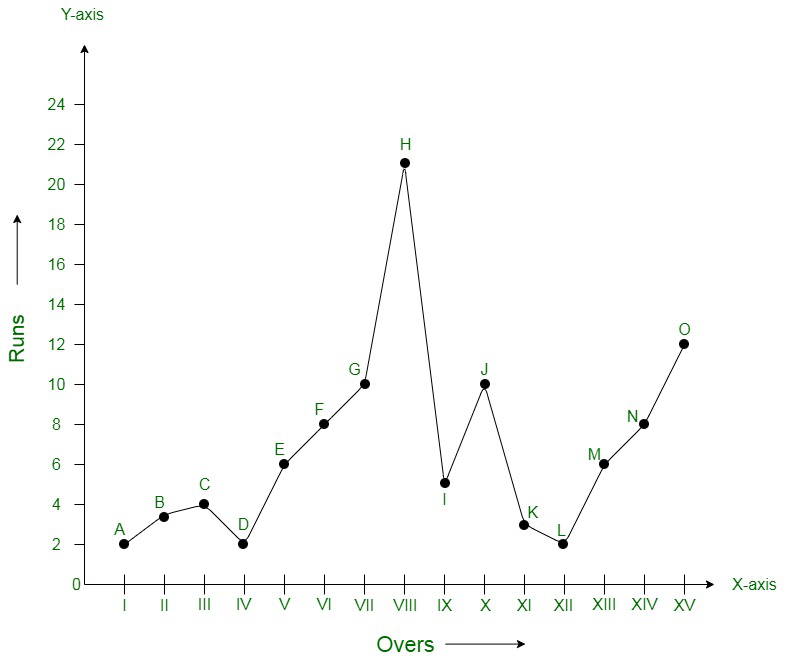
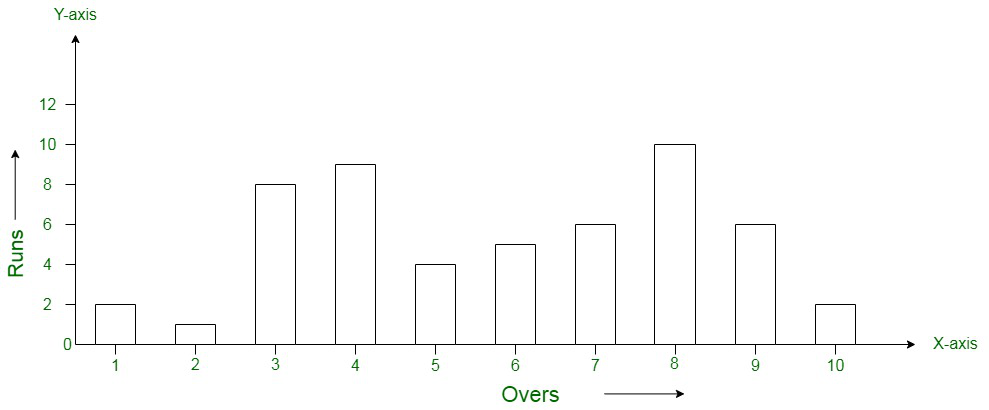
**Question 8. **The runs scored by a cricket team in first 15 overs are given below:
| **Overs: | **I | **II | **III | **IV | **V | **VI | **VII | **VIII | **IX | **X | **XI | **XII | **XIII | **XIV | **XV |
|---|---|---|---|---|---|---|---|---|---|---|---|---|---|---|---|
| **Runs: | **2 | **1 | **4 | **2 | **6 | **8 | **10 | **21 | **5 | **8 | **3 | **2 | **6 | **8 | **12 |
**Draw the graph representing the above data in two different ways as a graph and as a bar chart.
**Solution:
From the question as we know that,
Over - is an independent variable.
Run is a dependent variable.
So, take
Overs on the X - axis
Runs on the Y - axis.
Choose following scale:
X - axis: 1 cm = 1 over
Y - axis: 1 cm = 2 runs
Now, plot
(I, 2),
(II, 1),
(III, 4)…
(XV, 12).
Join these points on graph as shown below:
The bar graph is:
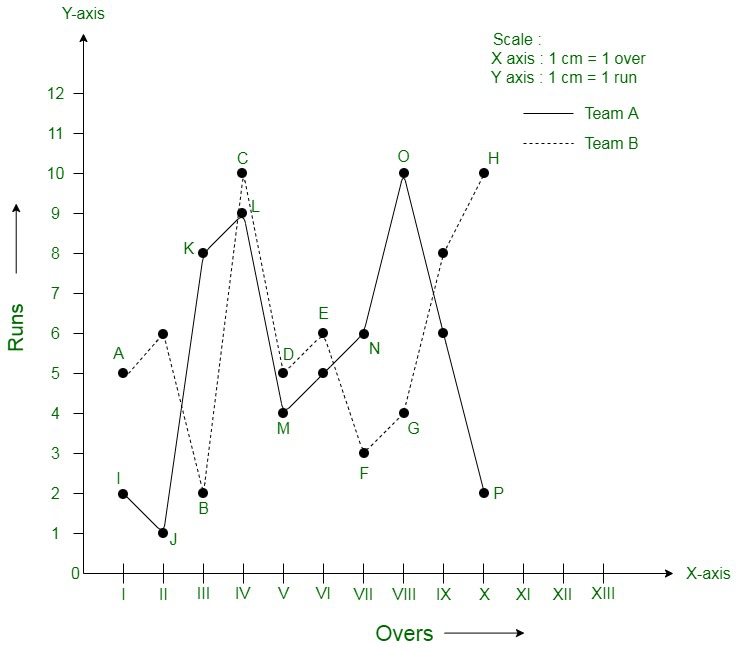
**Question 9. The runs scored by two teams A and B in first 10 overs are given below:
| **Overs | **I | **II | **III | **IV | **V | **VI | **VII | **VIII | **IX | **X |
|---|---|---|---|---|---|---|---|---|---|---|
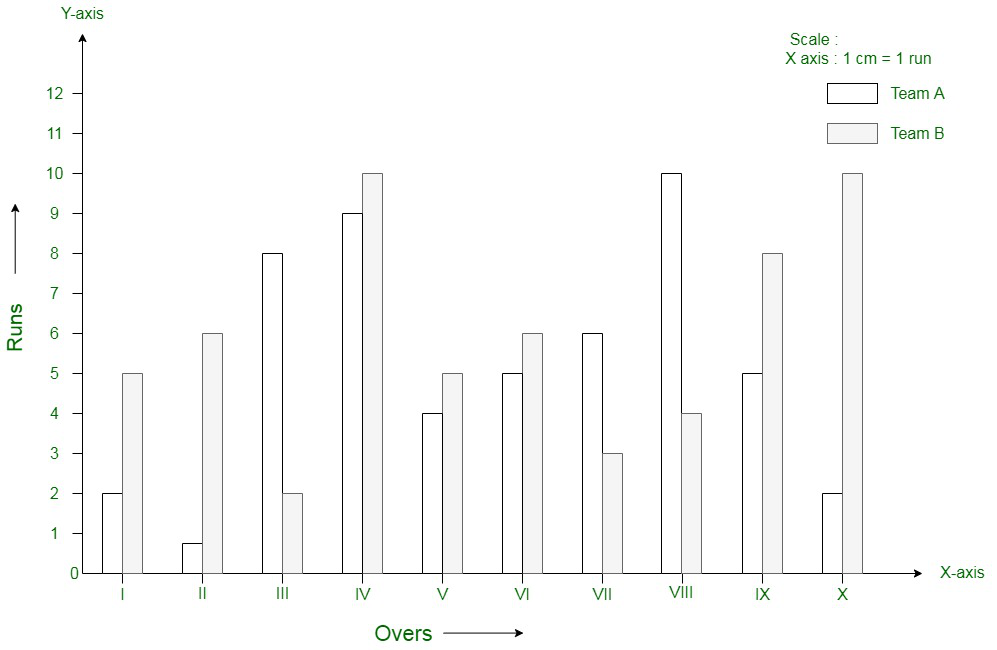
| **Team A | **2 | **1 | **8 | **9 | **4 | **5 | **6 | **10 | **6 | **2 |
| **Team B | **5 | **6 | **2 | **10 | **5 | **6 | **3 | **4 | **8 | **10 |
**Draw a graph depicting the data, making the graphs on the same axes in each case in two different ways as a graph and as a bar chart.
**Solution:
From the question as we know that,
Over - is an independent variable.
Run - is a dependent variable.
So, take
Overs on X - axis
Runs on the Y - axis.
Choose following scale:
X - axis: 1 cm = 1 over
Y - axis: 1 cm = 1 run
Now, plot
(I, 2),
(II, 1),
(III, 8)…
(X, 2) for team A
and
(I, 5),
(II, 6),
(III, 8) …..
(X, 10) for team B.
Join these points on graph as shown below:
The bar graph is:
Summary
Exercise 27.2 in RD Sharma's Class 8 textbook provides students with practice in graphing points on a coordinate plane, understanding the relationship between x and y coordinates, and applying basic concepts of analytical geometry. Through various questions, students learn to plot points, identify coordinates, and analyze the properties of points in different quadrants of the coordinate system.