Comparing Ordinal and Continuous Data (original) (raw)
Last Updated : 25 May, 2026
Ordinal and continuous data are two common types of data used in statistics.
- Ordinal data shows information in a specific order or ranking.
- Continuous data represents measurable values that can vary within a range.
Understanding these data types helps in proper data analysis and interpretation.
Ordinal Data
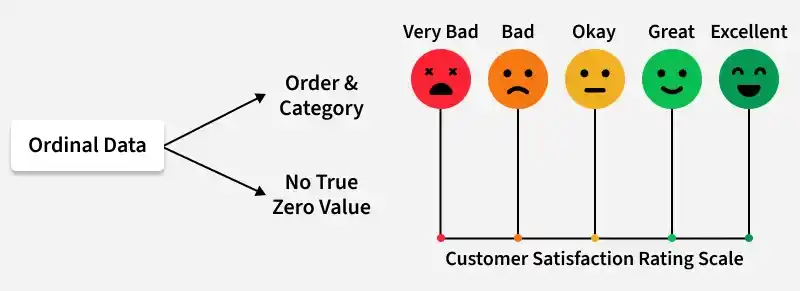
Ordinal data is a type of data in which values are arranged in a specific order or ranking, but the exact difference between the values cannot be measured. For example, ratings like “Poor,” “Average,” and “Excellent” show order, but the gap between them is not equal.
The image below shows ordinal data using customer satisfaction levels such as Very Bad, Bad, Okay, Good, Great, and Excellent arranged in a meaningful order.
Characteristics of Ordinal Data
The characteristics of ordinal data are as follows:
- Values in ordinal data are arranged in a meaningful order or ranking.
- The difference between the categories in ordinal data cannot be measured exactly.
- Ordinal data is divided into categories or groups.
- Median and mode are commonly used to analyse ordinal data.
- Mathematical operations like addition, subtraction, and averaging are not meaningful in ordinal data.
Continuous Data
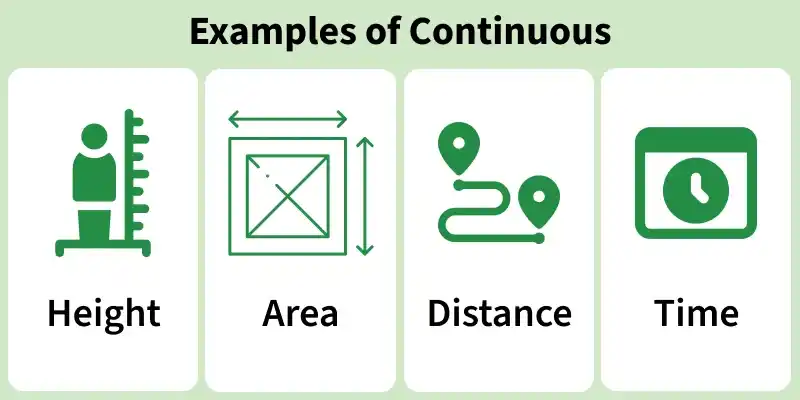
Continuous data is a type of numerical data that can take any value within a specific range. It is measured data, meaning the values can be divided into smaller parts and may include decimals or fractions.
The image below shows examples of continuous data such as height, area, distance, and time, which can take any value within a range.
Characteristics of Continuous Data
The characteristics of continuous data are as follows:
- Values can take any number within a given range.
- The difference between values is equal and measurable.
- Continuous data can include decimals and fractions.
- Mean, median, and mode can be used to analyse the data.
- Continuous data is suitable for parametric statistical tests.
- Mathematical operations like addition, subtraction, multiplication, and division are meaningful.
Ordinal vs Continuous Data
The comparison of Ordinal and Continuous data is as follows:
| Feature | Ordinal Data | Continuous Data |
|---|---|---|
| Nature | Categorial with order | Numerical with any value |
| Intervals | Unequal and non-measurable | Equal and measurable |
| Central Tendency | Median and mode | Mean, median, and mode |
| Statistical Tests | Non-parametric (e.g., Mann-Whitney) | Parametric (e.g., t-tests) |
| Arithmetic | Limited (cannot add or subtract) | Full range (addition, subtraction, etc.) |
Analysis Techniques
Analyzing ordinal and continuous data requires specific statistical methods. This section introduces the fundamental techniques and highlights their importance for accurate data interpretation.
Statistical Methods for Ordinal Data
The Statistical methods for Ordinal Data are:
**Median: It is a value that splits the set of values into two equal groups with half the values of the set greater than this value while the other half are lesser.
\text{Median} = \left\{\begin{array}{ll}\frac{X_{(n/2)} + X_{((n/2)+1)}}{2} & \text{if } n \text{ is even} \\X_{((n+1)/2)} & \text{if } n \text{ is odd}\end{array}\right.
**Mode: The value that appears most frequently in the data set.
Mode = Most frequent value
**Non-Parametric Tests: Suitable for data that do not fit normal distribution assumptions.
- **Mann-Whitney U Test: Compares differences between two independent groups.
- **Wilcoxon Signed-Rank Test: Compares paired samples to assess changes or differences
Statistical Methods for Continuous Data
The Statistical methods for Ordinal Data are:
**Mean: The average value of the data set.
\text{Mean} (\mu) = \frac{\sum_{i=1}^n x_i}{n}
**Standard Deviation: Measures how dispersed or scattered the values are in a set of values.
\sigma = \sqrt{\frac{\sum (x_i - \mu)^2}{n}}
**Parametric Tests: Suitable for normally distributed data.
- **t-tests: Compare means between groups.
- **ANOVA: Analyze differences among group means in a sample.
Choosing the Right Technique
The choice of a particular statistical method depends on the data collected and more so the nature of the research question that is being pursued. Regarding ordinal data, non-parametric tests are utilized primarily due to the nature of the data obtained. Continuous data that bear quantitative differences are more fitting for parametric tests and can afford more accurate and precise conclusions.
Applications of Ordinal and Continuous Data
Ordinal and continuous data are widely used in different fields to collect, organise, and analyse information.
- Ordinal data is commonly used in surveys, rankings, and customer satisfaction ratings.
- Continuous data is used to measure values such as height, weight, temperature, and time.
- Ordinal data helps compare categories based on order or preference.
- Continuous data provides accurate numerical measurements and supports detailed analysis.
- Ordinal data is used in education to rank students or performance levels.
- Continuous data is widely used in medical research, engineering, and weather forecasting.