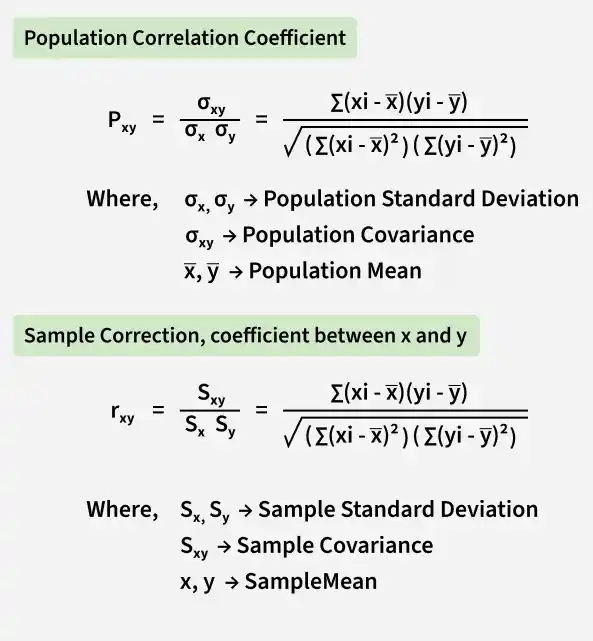
Correlation Coefficient Formula (original) (raw)
Last Updated : 23 May, 2026
The correlation coefficient is a numerical measure that shows the strength and direction of the relationship between two variables. Its value lies between -1 and +1.
**Types of Correlation
There are mainly 3 types of correlation.
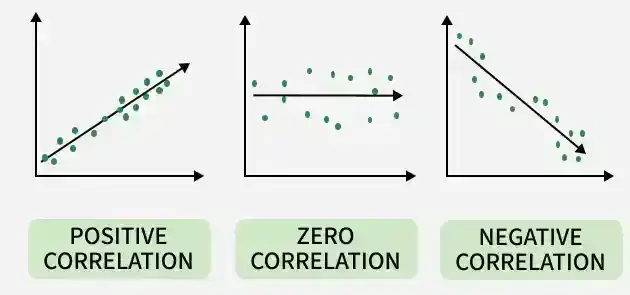
- **Positive Correlation: Both variables increase or decrease together.
- **Zero Correlation: No relationship between the variables.
- **Negative Correlation: One variable increases while the other decreases.
**Types of Correlation Coefficient Formula
Different formulas are used to calculate the correlation coefficient depending on the data (sample or population).
The main types are shown below:
Solved Problems
**Problem 1: Calculate the correlation coefficient from the following table:
| **SUBJECT | **AGE (X) | **GLUCOSE LEVEL (Y) |
|---|---|---|
| 1 | 42 | 98 |
| 2 | 23 | 68 |
| 3 | 22 | 73 |
| 4 | 47 | 79 |
| 5 | 50 | 88 |
| 6 | 60 | 82 |
**Solution:
Make a table from the given data and add three more columns of XY, X², and Y².
SUBJECT AGE (X) GLUCOSE LEVEL (Y) XY X² Y² 1 42 98 4116 1764 9604 2 23 68 1564 529 4624 3 22 73 1606 484 5329 4 47 79 3713 2209 6241 5 50 88 4400 2500 7744 6 60 82 4980 3600 6724 ∑ 244 488 20379 11086 40266 ∑xy = 20379
∑x = 244
∑y = 488
∑x² = 11086
∑y² = 40266
n = 6.
Put all the values in the Pearson's correlation coefficient formula:
R= \frac{n(∑xy) - (∑x)(∑y)}{\sqrt{[n∑x²-(∑x)²][n∑y²-(∑y)²}}
R = 6(20379) - (244)(488) / √[6(11086)-(244)²][6(40266)-(488)² ]
R = 3202 / √[6980][3452]
R = 3202/4972.238
R = 0.6439
It shows that the relationship between the variables of the data is a strong positive relationship.
**Problem 2: Calculate the correlation coefficient from the following table:
| **SUBJECT | **AGE (X) | **Weight (Y) |
|---|---|---|
| 1 | 40 | 99 |
| 2 | 25 | 79 |
| 3 | 22 | 69 |
| 4 | 54 | 89 |
**Solution:
Make a table from the given data and add three more columns of XY, X², and Y².
SUBJECT AGE (X) Weight (Y) XY X² Y² 1 40 99 3960 1600 9801 2 25 79 1975 625 6241 3 22 69 1518 484 4761 4 54 89 4806 2916 7921 ∑ 151 336 12259 5625 28724 ∑xy = 12258
∑x = 151
∑y = 336
∑x² = 5625
∑y² 28724
n = 4
Put all the values in the Pearson's correlation coefficient formula:
R= \frac{n(∑xy) - (∑x)(∑y)}{\sqrt{[n∑x²-(∑x)²][n∑y²-(∑y)²}}
R = 4(12258) - (151)(336) / √[4(5625)-(151)²][4(28724)-(336)²]
R = -1704 / √[-301][-2000]
R=-1704/775.886
R=-2.1961
It shows that the relationship between the variables of the data is a very strong negative relationship.
**Problem 3: Calculate the correlation coefficient for the following data:
X = 7,9,14 and Y = 17,19,21
**Solution:
Given variables are,
X = 7,9,14
and,
Y = 17,19,21
To, find the correlation coefficient of the following variables Firstly a table is to be constructed as follows, to get the values required in the formula.
X Y XY X² Y² 7 17 119 49 36 9 19 171 81 361 14 21 294 196 441 ∑ 30 ∑ 57 ∑ 584 ∑ 326 ∑ 838 ∑xy = 584
∑x = 30
∑y = 57
∑x² = 326
∑y² = 838
n = 3
Put all the values in the Pearson's correlation coefficient formula:
R= \frac{n(∑xy) - (∑x)(∑y)}{\sqrt{[n∑x²-(∑x)²][n∑y²-(∑y)²}}
R = 3(584) - (30)(57) / √[3(326)-(30)²][3(838)-(57)²]
R = 42 / √[78][-735]
R = 42/-239.43
R = -0.1754
It shows that the relationship between the variables of the data is negligible relationship
**Problem 4: Calculate the correlation coefficient for the following data:
X = 21, 31, 25, 40, 47, 38 and Y = 70,55,60,78,66,80
**Solution:
Given variables are,
X = 21,31,25,40,47,38
And,
Y = 70,55,60,78,66,80
To, find the correlation coefficient of the following variables Firstly a table is to be constructed as follows, to get the values required in the formula.
X Y XY X² Y² 21 70 1470 441 4900 31 55 1705 961 3025 25 60 1500 625 3600 40 78 3120 1600 6094 47 66 3102 2209 4356 38 80 3040 1444 6400 ∑202 ∑409 ∑13937 ∑7280 ∑28265 ∑xy = 13937
∑x = 202
∑y = 409
∑x² = 7280
∑y² = 28265
n = 6
Put all the values in the Pearson's correlation coefficient formula:
R= \frac{n(∑xy) - (∑x)(∑y)}{\sqrt{[n∑x²-(∑x)²][n∑y²-(∑y)²}}
R = 6(13937) - (202)(409) / √[6(7280) - (202)²][6(28265) - (409)²]
R = 1004 /√[2876][2909]
R = 1004 / 2892.452938
R = 0.3471
It shows that the relationship between the variables of the data is a moderate positive relationship.
**Problem 5: Calculate the correlation coefficient for the following data?
X = 5 ,9 ,14, 16 and Y = 6, 10, 16, 20 .
**Solution:
Given variables are,
X = 5 ,9 ,14, 16
And
Y = 6, 10, 16, 20.
To, find the correlation coefficient of the following variables Firstly a table is to be constructed as follows, to get the values required in the formula add all the values in the columns to get the values used in the formula
X Y XY X² Y² 5 6 30 25 36 9 10 90 81 100 14 16 224 196 256 16 20 320 256 400 ∑44 ∑52 ∑664 ∑558 ∑792 ∑xy = 664
∑x = 44
∑y = 52
∑x² = 558
∑y² = 792
n = 4
Put all the values in the Pearson's correlation coefficient formula:
R= n(∑xy) - (∑x)(∑y) / √[n∑x²-(∑x)²][n∑y²-(∑y)²
R = 4(664) - (44)(52) / √[4(558) - (44)²][4(792) - (52)²]
R = 368 / √[296][464]
R = 368/370.599
R = 0.9930
It shows that the relationship between the variables of the data is a very strong positive relationship.