Cumulative frequency Curve (original) (raw)
Last Updated : 23 Jul, 2025
In statistics, graph plays an important role. With the help of these graphs, we can easily understand the data. So in this article, we will learn how to represent the cumulative frequency distribution graphically.
Cumulative Frequency
The frequency is the number of times the event occurs in the given situation and the cumulative frequencies are the sum of all the previous frequencies up to the current frequency. Or in other words, the cumulative frequency of a class is the frequency calculated by adding the frequencies of all the classes preceding the given class. For example:
| **Interval | **Frequency |
|---|---|
| 0-10 | 2 |
| 10-20 | 4 |
| 20-30 | 5 |
In the above table, we have intervals and frequencies now we are going to find the cumulative frequency by adding all the previous frequencies up to the current frequency.
| **Interval | **Frequency | **Cumulative frequency |
|---|---|---|
| 0-10 | 2 | 2 |
| 10-20 | 4 | 6 |
| 20-30 | 5 | 11 |
So, here the cumulative frequency of interval(0-10) is 2 because this is the very first frequency. Similarly, the cumulative frequency of interval(10-20) is 6 because it is the sum of 2(previous frequency) + 4(current frequency), and the cumulative frequency of interval(20-30) is 11 because it is the sum of 2 + 4(previous frequency) + 5(current frequency). Such type of table is known as a cumulative frequency table.
Cumulative Frequency Curve
Let us considered a grouped frequency distribution be given to us. Take a graph paper and mark the upper-class limits along the x-axis and the corresponding cumulative frequencies along the y-axis. Join these points successively by smooth curves, we will get a curve, this curve is known as cumulative frequency curve. Or in other words, the graphical representation of cumulative frequency distribution is known as cumulative frequency curve. It is also known as ogive, and it is the most efficient way to represent data. The cumulative frequency curve is of two types:
****(1) Less than cumulative frequency curve**
As we know that the cumulative frequency curves are created using the cumulative frequencies so, in less than the cumulative frequency curve, the frequencies of all the preceding class or interval are added to the current class or interval frequency. You can create more than cumulative frequency by adding the frequency of first-class to the frequency second-class and so on. For example:
| **Interval | **Frequency |
|---|---|
| 5-10 | 2 |
| 10-15 | 4 |
| 15-20 | 5 |
In the above table, we have intervals and frequencies now we are going to find less than the cumulative frequency by adding all the previous frequencies up to the current frequency.
| **Interval | **Frequency | **Cumulative frequency | **Upper Limit |
|---|---|---|---|
| 5-10 | 2 | 2 | 10 |
| 10-15 | 4 | 2 + 4 = 6 | 15 |
| 15-20 | 5 | 2 + 4 + 5 = 11 | 20 |
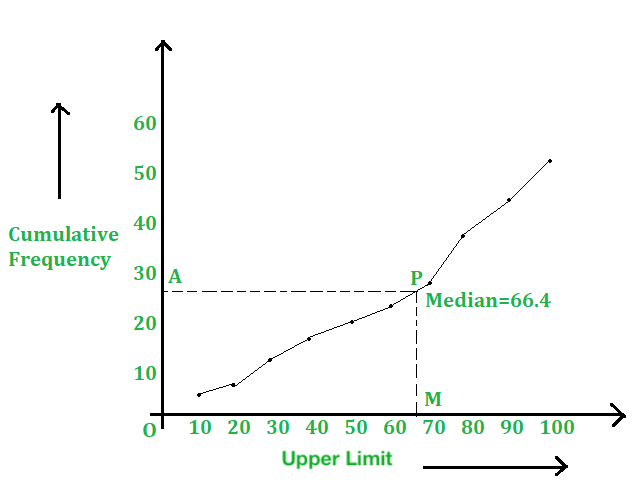
**How to draw less than cumulative frequency curve:
In this case, we use the upper limit of the classes to draw the curve. Now, the step-by-step process of plotting a less than cumulative frequency curve:
- Take a graph paper and mark the upper-class limits along the x-axis and the corresponding cumulative frequencies along the y-axis.
- Join these points successively by line segments, we will get a polygon, known as a cumulative frequency polygon.
- Join these points successively by a smooth curve, we will get a curve, known as cumulative frequency graph.
- Take a point A (0, N/2) on the y-axis and draw AP || x-axis, cutting the above curve at a point P. Draw PM ⊥ to the x-axis, cutting the x-axis at M.
- Then, the median length of OM.
****(2) More than cumulative frequency curve**
As we know that the cumulative frequency curves are created using the cumulative frequencies so, in more than cumulative frequency curve, the frequencies of succeeding class or interval are added to the current class or interval frequency. You can create more than cumulative frequency by subtracting the frequency of the second-class from the first class and so on. For example:
| **Interval | **Frequency |
|---|---|
| 5-10 | 20 |
| 10-15 | 4 |
| 15-20 | 5 |
In the above table, we have intervals and frequencies now we are going to find more than the cumulative frequency:
| **Interval | **Frequency | **Cumulative frequency | **Lower Limit |
|---|---|---|---|
| 5-10 | 20 | 20 | 5 |
| 10-15 | 4 | 20 - 4 = 16 | 10 |
| 15-20 | 5 | 16 - 5 = 11 | 15 |
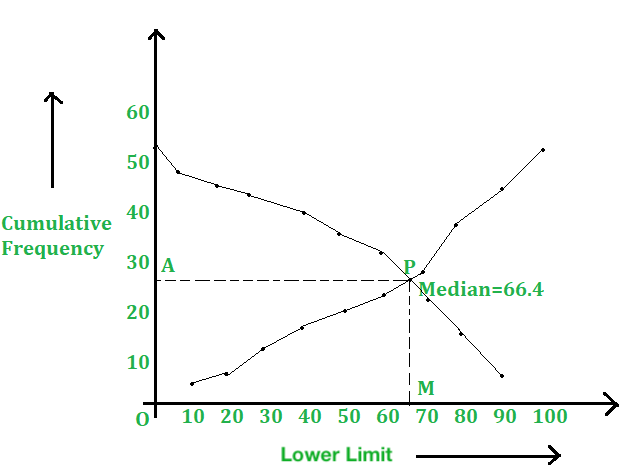
**How to draw more than cumulative frequency curve:
In this case, we use the lower limit of the classes to draw the curve. Now, the step-by-step process of plotting a more than Cumulative Frequency curve:
- Take a graph paper and mark the lower class limits along the x-axis and the corresponding cumulative frequencies along the y-axis.
- Join these points successively by line segments, we will get a polygon, known as a cumulative frequency polygon.
- Join these points successively by a smooth curve, we will get a curve, known as cumulative frequency graph.
- We assume that P be the point of intersection of less than' and 'more than curves. Draw PM ⊥ to the y-axis, cutting x-axis at M.
- Then, median = length of OM.
Solved Problems
**Question 1. Following is the age distribution of group students. Now, draw the cumulative frequency curve of less than type and find the median value.
| Age (in years) | Frequency |
|---|---|
| 4-5 | 36 |
| 5-6 | 42 |
| 6-7 | 52 |
| 7-8 | 60 |
| 8-9 | 68 |
| 9-10 | 84 |
| 10-11 | 96 |
| 11-12 | 82 |
| 12-13 | 66 |
| 13-14 | 48 |
| 14-15 | 50 |
| 15-16 | 16 |
**Solution:
For the given table, we have to prepare the more than series as shown below:
Age (in years) c.f. Less than 5 36 Less than 6 78 Less than 7 130 Less than 8 190 Less than 9 258 Less than 10 342 Less than 11 438 Less than 12 520 Less than 13 586 Less than 14 634 Less than 15 684 Less than 16 700 On a graph paper, take the scale
Along the x-axis: 5 small div. = 1.
Along the y-axis: 1 small div. = 10.
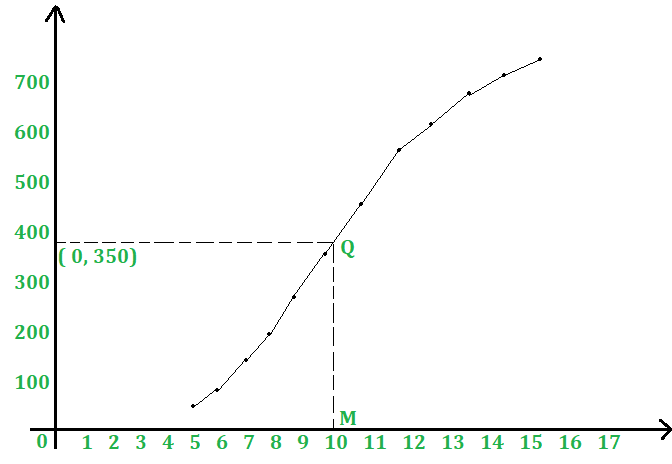
And, plot all the points A(5, 36), B(6, 78), C(7, 130), D(8, 190), E(9, 258), F(10, 342), G(11, 438),
H(12, 520), I(13, 586), J(14, 634), K(15, 684) and L(16, 700).
Join these points successively with a freehand, we will get the cumulative frequency curve or an ogive.
Here, N = 700 ⇒ N/2 = 350
Take a point P(0, 350) on the y-axis and draw PQ|| x-axis, meeting the curve at Q. Draw QM 1 x-axis, intersecting x-axis at M. Then, OM = 10 units.
Hence, median = 10.
**Question 2. For the given frequency distribution, draw a cumulative frequency graph of more than type and find the median value.
| Class Interval | 0-10 | 10-20 | 20-30 | 30-40 | 40-50 | 50-60 | 60-70 |
|---|---|---|---|---|---|---|---|
| Frequency | 5 | 15 | 20 | 23 | 17 | 11 | 9 |
**Solution:
For the given table, we have to prepare the more than series as shown below:
More than 60 9 More than 50 20 More than 40 37 More than 30 60 More than 20 80 More than 10 95 More than 5 100 **Scale: Along the x-axis, 10 small div. = 5.
Along the y-axis, 1 small div.= 1.
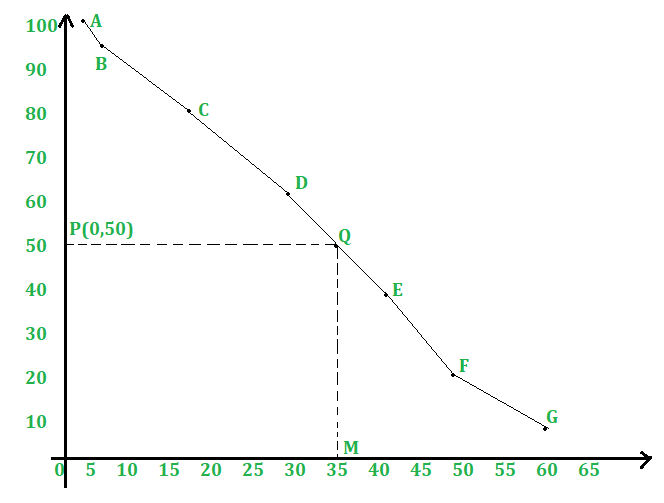
Plot all the points A(5, 100), B(10, 95), C(20, 80), D(30, 60), E(40, 37), F(50, 20) and G(60, 9).
Join AB, BC, CD, DE, EF and FG with a freehand, and we will get the required curve, as shown in below figure.
Here, N = 100
⇒ N/2 = 50
From P(0, 50) draw PQ || x-axis, meeting the curve at Q. Draw QM ⊥ OZ, meeting x-axis at M. Clearly, OM = 35 units
**Hence, median = 35.
**Question 3. The following table gives the production yield of rice of 100 farms of a village:
| Production (kg/hectare) | 40-45 | 45-50 | 50-55 | 55-60 | 60-65 | 65-70 |
|---|---|---|---|---|---|---|
| Number of farms | 4 | 6 | 16 | 20 | 30 | 24 |
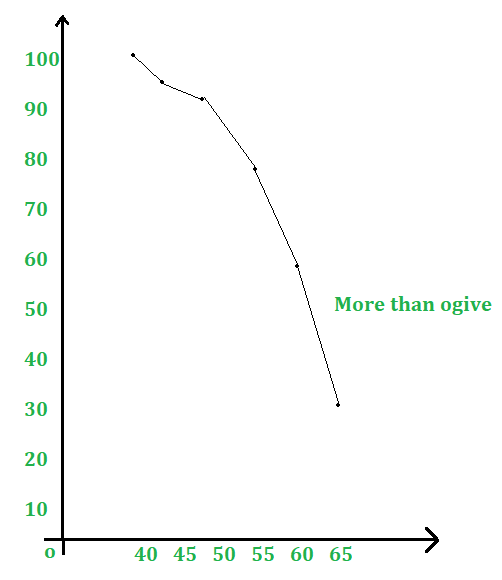
**Draw a cumulative frequency graph of more than type.
**Solution:
For the given table, we have to prepare the more than series as shown below:
More than 65 24 More than 60 54 More than 55 74 More than 50 90 More than 45 96 More than 40 100 Scale: Along the x-axis, 1 small div.= 1
Along the y-axis, 1 small div. = 1
On a graph paper, plot all the points A(40, 100), B(45, 96), C(50, 90), D(55, 74), E(60, 54) and F(65, 24).
Join AB, BC, CD, DE and EF with a free hand, and we will get a More Than Ogive.
**Question 4. During the medical checkup of 35 students of a college their weights were recorded as follows:
| Weight(in kg) | 38-40 | 40-42 | 42-44 | 44-46 | 46-48 | 48-50 | 50-52 |
|---|---|---|---|---|---|---|---|
| No. of Students | 3 | 2 | 4 | 5 | 14 | 4 | 3 |
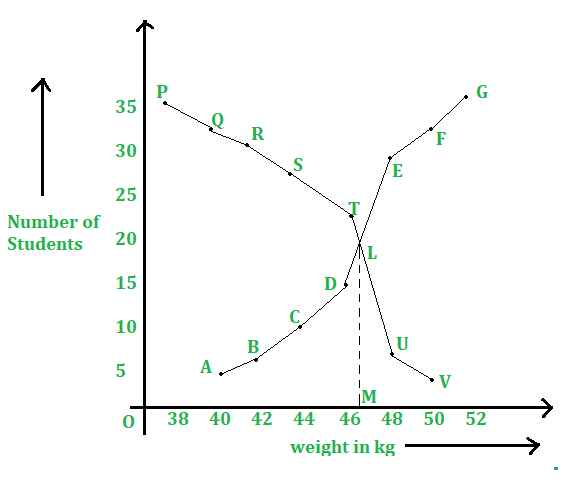
**Draw a less than and a more than type ogive from the given data. Hence, find the median weight from the graph.
**Solution:
****(i) Less than Series:**
For the given table, we have to prepare the less than series as shown below:
Weight (in kg) Number of Students Less than 40 3 Less than 42 5 Less than 44 9 Less than 46 14 Less than 48 28 Less than 50 32 Less than 52 35 **Scale: Along the x-axis, 5 small div. = 1 kg.
Along the y-axis, 10 small div.= 5 kg.
Plot all the points A(40, 3), B(42, 5), C(44, 9), D(46, 14), E(48, 28), F(50, 32) and G(52, 35).
Join AB, BC, CD, DE, EF and FG with a free hand to get the curve 'Less Than Series'.
****(ii) More than Series:**
For the given table, we have to prepare the more than series as shown below:
Weight (in kg) Number of Students More than 38 35 More than 40 32 More than 42 30 More than 44 26 More than 46 21 More than 48 7 More than 50 3 Now plot the points on the same graph: P(38,35), Q(40, 32), R(42, 30), S(44, 26), T(46, 21), U(48, 7) and V(50,3)
and join PQ, QR, RS, ST, TU and UV with a free hand to get 'More Than Series'.
The two curves intersect at the point L. Draw LM ⊥ OX.
**Hence, median weight = OM = 46.5 kg.
Practice Problems on Cumulative frequency Curve
- Draw a less than cumulative frequency graph for the following data and find the median:
Class Interval Frequency 10-20 8 20-30 12 30-40 15 40-50 10 - Create a more than cumulative frequency table and graph for the following data:
Class Interval Frequency 0-5 7 5-10 13 10-15 15 - For the age distribution of students in a class, create a less than cumulative frequency graph.
- Construct a more than cumulative frequency curve for the given weight distribution of 50 students.
- Draw both less than and more than cumulative frequency curves for the following height distribution.
Summary
Cumulative frequency distributions are essential in statistics for summarizing and visualizing data. By using less than and more than cumulative frequency curves, we can effectively determine medians and understand data distribution. Mastering these techniques can enhance data analysis and interpretation skills.