Graph of Linear Equations in Two Variables (original) (raw)
Last Updated : 24 Feb, 2026
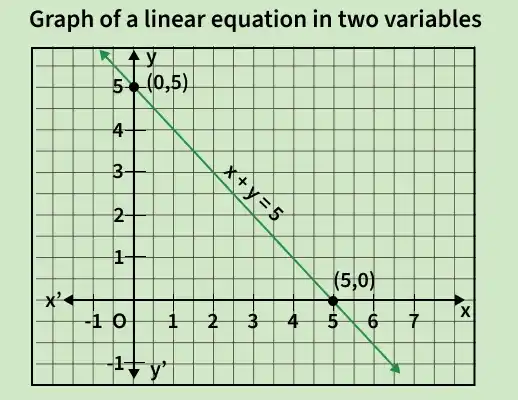
The graph of a linear equation is a straight line. It is drawn using coordinate pairs (x, y) that satisfy the equation.
By substituting different values of x, we obtain corresponding values of y. The pairs obtained, such as (x1, y1), (x2, y2), (x3, y3), and so on, are plotted on the coordinate plane. Joining these points forms a straight line.
For example: x + y = 5
**Plotting the points
The following are the steps to plot points on the graph:
- **Step 1: Pick different values of x
- **Step 2: Substitute those values in the given equation to solve for the values of y
- **Step 3: Plot the obtained respective pairs on the graph
- **Step 4: Obtaining such pairs (at least two or more than two) would help us identify how the straight line goes.
**Finding X and Y Intercepts
The following are the steps to find the x and y-intercepts:
- **Step 1: In order to find y-intercept, set x= 0, and solve for the value of y
- **Step 2: In order to find x-intercept, set y=0, and solve for the value of x
- **Step 3: Plot both the point on the graph and join them with a straight line.
Sample Problems
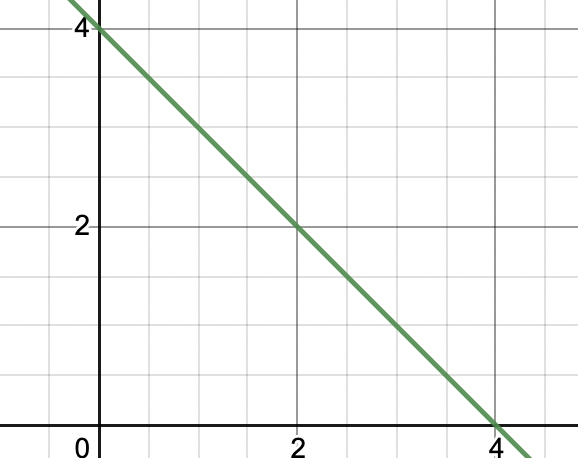
**Question 1: Plot the graph of the equation, x + y = 4
Let's list out the solutions of this equation.
**x 0 1 2 3 4 5 ... **y 4 3 2 1 0 -1 ... If we keep on listing these solutions, we will see that they form a straight line. Let's plot that line of the graph.
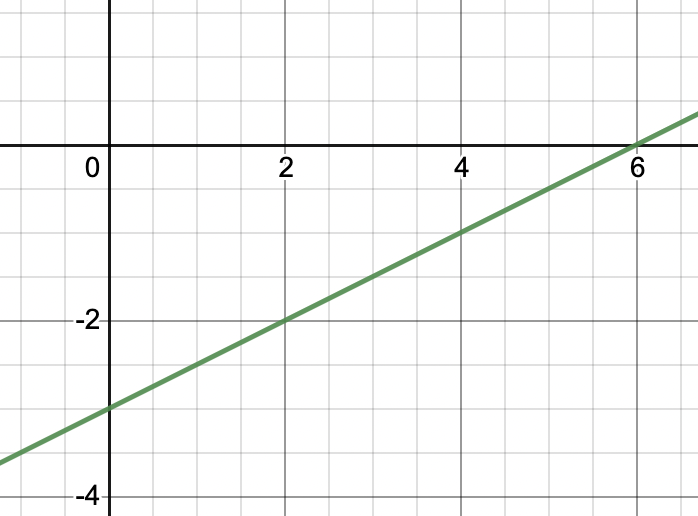
**Question 2: Plot the graph of the equation, 2x - 4y = 12
Let's list out the solutions to this equation,
**x 0 1 2 3 4 **y -3 -2.5 -2 -1.5 -1 We can join any of two these points to get the line.
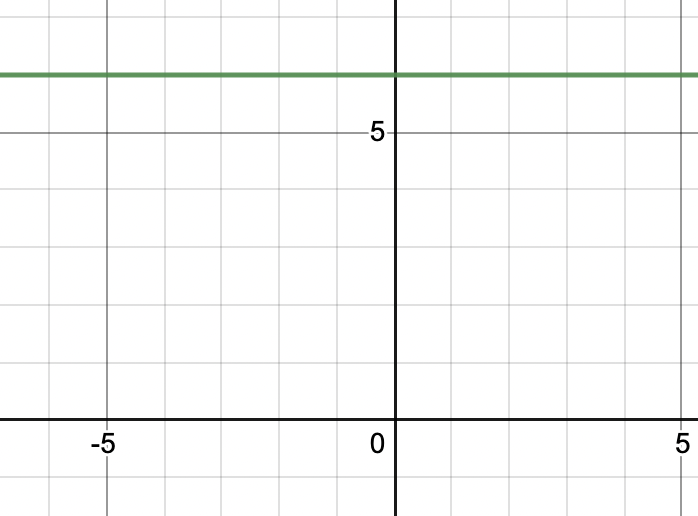
**Question 3: Plot the graph of the following equation: y = 6
The equation when written in the form of linear equation in two variables 0.x + 1.y = 6
We can see that it doesn't matter what value of “x” we put in, it won't affect the equation. So, to satisfy the equation value of “y” must be 6. Thus, our solution must have y = 6 and any other value of "x" will work.
So, the graph will look like this,
Notice that this graph is parallel to x -axis.
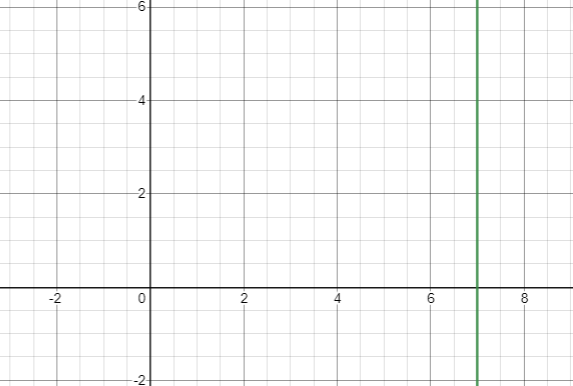
**Question 4: Plot the graph of the following equation. x = 7
**This equation can be represented as- 1.x + 0.y = 7
Here, value of “y” doesn't matter and the value of “x” must be 7.
So, plotting this on the graph.
Thus, this is graph for x = 4.
Practice Questions
**Question 1: Plot the graph of the linear equation: x + y = 4
**Question 2: Plot the graph of the following equation: y = 6
**Question 3: Plot the graph of the following equation: x = 7
**Question 4: Plot the graph of the linear equation: 2x − 4y = 12