Graph of Quadratic Function (original) (raw)
Last Updated : 8 Jun, 2026
A quadratic function is a function whose highest power of the variable is 2. It is written in the form f(x) = ax² + bx + c, where a, b, and c are real numbers and a ≠ 0.
The graph of a quadratic function is called a parabola, a U-shaped curve that may open upward or downward.
Key Characteristics of Quadratic Functions
- **Direction: The direction of a parabola depends on the coefficient a. If a > 0, the parabola opens upward, while if a < 0, it opens downward.
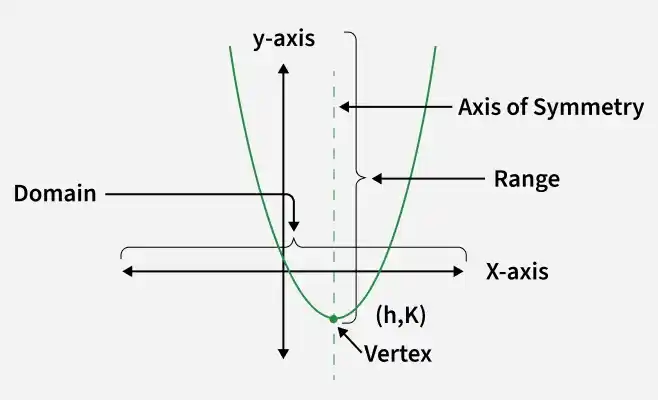
- **Vertex: The vertex is the highest or lowest point on the parabola. It represents the maximum value for a downward-opening parabola and the minimum value for an upward-opening parabola.
- **Axis of Symmetry: The axis of symmetry is a vertical line passing through the vertex that divides the parabola into two equal and symmetrical halves.
- **x-intercepts: These are the points where the parabola crosses the x-axis. They represent the solutions or roots of the quadratic equation.
- **y-intercept: This is the point where the parabola crosses the y-axis and indicates the value of the function when x = 0.
- **Domain and Range: The domain of a quadratic function consists of all real numbers. The range depends on the position of the vertex and the direction in which the parabola opens.
Steps to Graph a Quadratic Function
- Find the vertex of the parabola.
- Determine the axis of symmetry.
- Find the x-intercepts, if any.
- Find the y-intercept.
- Plot the points on the coordinate plane.
- Draw a smooth parabola through the plotted points.
Graph of Quadratic Function Cases
The graph of a quadratic equation has two cases, which are as follows:
**1. Upward Case (a > 0)
The direction of the graph completely depends upon the value of the coefficient of x2, i.e., 'a'. If a is greater than zero, then the parabola thus formed will open upwards.
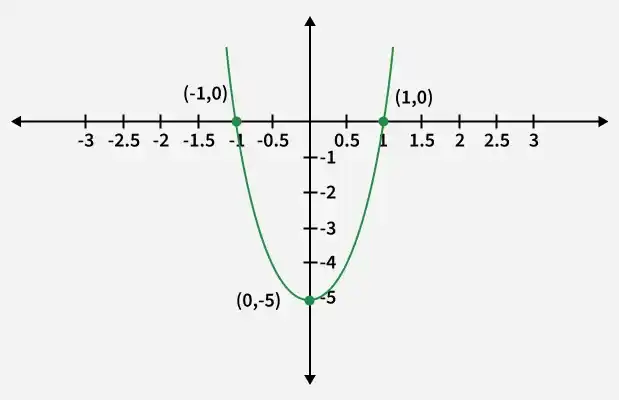
**Example: Plot a graph of the quadratic equation y = 5x - 5.
**Solution:
We have the equation: y = 5x2 - 5, on comparing it with f(x) = ax2 + bx + c
we have, a = 5, b = 0 and c = -5.
The vertex of the above equation is:
x = -b/(2a)
x = -0/(2(5))
x = 0Now put x = 0 in the equation y = 5x2 - 5
y = 5(0)2 - 5
y = 0 - 5
y = -5The vertex of the above equation is (0, -5).
Now, find the different values of x and y by solving the equation:
x 0 1 -1 y -5 0 0 Plot the graph with these coordinates, the graph thus obtained will be a parabola opening upwards as a = 5 >0.
**2. Downward Case (a < 0)
The direction of the parabola formed for the given quadratic equation will be oriented downwards if the value of the coefficient of x2, i.e., 'a,' is less than zero.
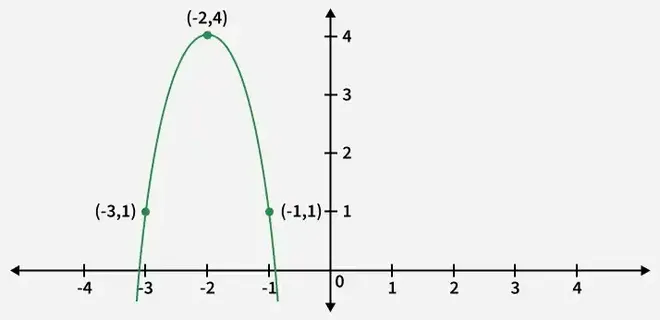
**Example: Plot a graph of quadratic equation y = -3(x + 2)2 + 4.
**Solution:
We have the equation: y = -3(x + 2)2 + 4, on comparing it with a(x – h)2 + k = 0
we have, h = -2, k = 4 and a = -3
The vertex of the above equation is given by (h, k), so vertex is (-2, 4)
Also a = -3, the negative value represent the downward direction of the parabola and so the vertex (-2, 4) is the point of absolute maxima.
Now, find the different values of x and y by solving the equation:
x -3 -1 -2 y 1 1 4 Plot the graph with these coordinates, the graph thus obtained will be a parabola opening downwards as a = -3 < 0.
Graphing Quadratic Functions in Vertex Form
A quadratic function in vertex form is written as
f(x) = a(x − h)² + k
This form makes it easy to identify the vertex of the parabola, which is located at (h, k). To graph the function, plot the vertex and a few additional points, then draw a smooth curve through them. The resulting graph is a parabola that opens upward when a > 0 and downward when a < 0.
Steps to Graph a Quadratic Function in Vertex Form
- Draw the x-axis and y-axis.
- Identify and plot the vertex (h, k).
- Find a few additional points by substituting values of x into the function.
- Plot the points on the coordinate plane.
- Draw a smooth parabola through the plotted points.
Solved Examples
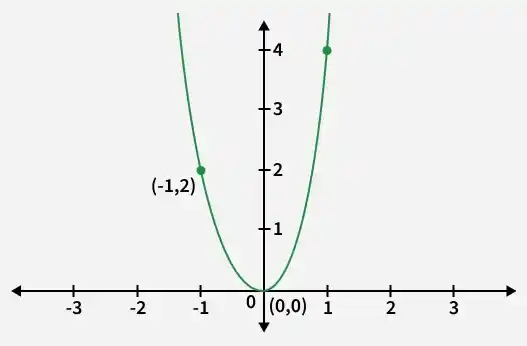
**Example 1: Draw the graph of the quadratic equation y = 3x + x.
**Solution:
We have the equation: y = 3x2 + x, on comparing it with f(x) = ax2 + bx + c
we have, a = 3, b = 1 and c = 0.
The vertex of the above equation is:
x = -b/(2a)
x = -1/(2(3))
x = -1/ 6
x = -0.166Now put x = -0.166 in the equation y = 3x2 + x
y= 3(-0.166)2 + (-0.166).
y = 3(0.0275) – 0.166
y = 0.0825 – 0.166
y = -0.0835The vertex of the above equation is (-0.166, -0.0835)
Now, find the different values of x and y by solving the equation:
x 0 1 -1 y 0 4 2 Plot the graph with these coordinates, the graph thus obtained will be a parabola opening upwards as a = 3 >0.
**Example 2: Determine the axis of symmetry and the y-intercept of the quadratic function f(x) = 5x2 + 4x + 1.
**Solution:
We have the equation: y = 5x2 + 4x +1
Here, a = 5, b = 4 and c = 1The axis of symmetry is given by x = -b/2a, putting values we get,
x = -4/2(5)
x = -4/10
x = -0.4y-intercept is given by (0, c)
Here c = 1, so y-intercept = (0, 1).
Hence, the axis of symmetry and the y-intercept of the quadratic function f(x) = 5x2 + 4x +1 is -0.4 and (0, 1) respectively.
Important Formulas
| Feature | Formula / Description |
|---|---|
| **Standard Form | f(x) = ax² + bx + c |
| **Vertex Form | f(x) = a(x − h)² + k |
| **Graph Shape | U-shaped curve called a Parabola |
| **Vertex | (-b/2a, -D/4a) |
| **Axis of Symmetry | x = -b/2a |
| **y-intercept | (0, c) |
| **x-intercepts | x = (-b ± √(b² − 4ac)) / 2a |
**Related Articles