Line of Best Fit (original) (raw)
Last Updated : 25 Mar, 2026
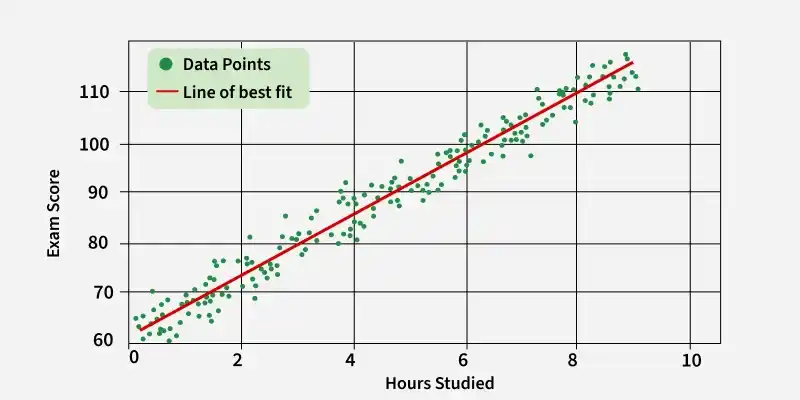
A line of best fit is a straight line drawn on a scatter plot that shows the relationship between two variables. It passes through the data in such a way that it lies closest to most of the data points.
This line helps us
- Identify trends (increasing, decreasing, or constant)
- Make predictions about one variable based on the value of another variable.
The line of best fit is usually calculated using a statistical method called linear regression, which minimizes the distance between the line and the data points. The line of best fit is also called a trend line or regression line.
This line is also a predictive tool, useful for forecasting trends, such as market indicators and price movements.
Formula
The equation of the line of best fit is:
y = mx + b
where:
- m is Slope of Line
- b is Y-Intercept
Calculating the Line of Best Fit
Calculating the line of best fit involves finding the slope and y-intercept of the line that minimizes the overall distance between the line and the data points. A regression with two independent variables is solved using a formula.
y = c + b1(x1) + b2(x2)
where,
- y is the dependent variable.
- c is Constant
- b1 is the first regression coefficient.
- x1 is the first independent variable.
- b2 is the second regression coefficient.
- x2 is the second independent variable.
To find the line of best fit, you can use various statistical software or programming languages like Python or R, which have built-in functions for regression analysis. Alternatively, you can manually calculate the line's parameters using statistical formulas.
By determining the line of best fit, the aim is to minimize the vertical distances between the line and the data points, providing the closest approximation of the overall trend.
**Example: Consider a dataset representing the relationship between the number of hours studied and the score achieved on a test.
| Hours Studied | Test Score |
|---|---|
| 2 | 65 |
| 3 | 70 |
| 4 | 75 |
| 5 | 80 |
| 6 | 85 |
By calculating the line of best fit for this data, we can predict the test score based on the number of hours studied. Let's assume the line of best fit equation given is: y = mx + b
Test Score = 5 × Hours Studied + 60
where:
- m = 5
- b = 60
Applications
Line of best fit is essential for several reasons:
- **Prediction: It enables us to predict the values of one variable based on the values of another variable.
- **Trend Analysis: It helps in identifying trends and patterns in the data.
- **Decision Making: Businesses use it to make informed decisions based on historical data trends.
**Related Articles
Solved Examples
**Example 1: For the following data, the equation of the line of best fit is y = -3.2x + 880. Find how many people will attend the show if the ticket price is $15.
| Ticket price (x) (in $) | 12 | 15 | 18 | 20 |
|---|---|---|---|---|
| Number of people attending (y) | 780 | 800 | 820 | 830 |
Substitute ticket price as x = 15 into the equation of line of best fit
y = -3.2x + 880
y = -3.2 × 15 + 880 = 832
832 people will attend the show if the ticket price is $15.
**Example 2: For the following data, the equation of the line of best fit is y = -6.5x + 1350. Find how many people will purchase chocolate if the price of chocolate is $30.
| Chocolate price (x) | 25∣25 | 25∣30 | 35∣35 | 35∣40 |
|---|---|---|---|---|
| Number of people purchasing chocolate (y) | 480 | 600 | 720 | 840 |
Substitute chocolate price as x = 30 into the equation of line of best fit
y = -6.5x + 1350
y = -6.5 × 30 + 1350 = 1155
1155 people will purchase chocolate if the price is $30.
**Example 3: For the following data, the equation of the line of best fit is y = -2.1x + 1220. Find how many people will buy candy if the price of candy is $10.
| Candy price (x) | 8∣8 | 8∣10 | 12∣12 | 12∣14 |
|---|---|---|---|---|
| Number of people buying candy (y) | 1180 | 1200 | 1220 | 1240 |
Substitute x = 10 into the equation of line of best fit
y = -2.1x + 1220
y = -2.1 × 10 + 1220 = 1199
1199 people will buy candy if the price is $10.
**Example 4: For the following data, the equation of the line of best fit is y = -5.8x + 1320. Find how many people will attend the concert show if the ticket price is $25.
| Concert ticket price (x) | 20∣20 | 20∣25 | 30∣30 | 30∣35 |
|---|---|---|---|---|
| Number of people attending concert (y) | 660 | 500 | 340 | 180 |
Substitute ticket price as x = 25 into the equation of line of best fit
y = -5.8x + 1320
y = -5.8 × 25 + 1320 = 1175
1175 people will attend the concert show if the ticket price is $25.
**Example 5: For the following data, the equation of the line of best fit is y = -3.7x + 1020. Find how many people will buy cigarettes if the price is $25.
| Cigarette price (x) | 15∣15 | 15∣18 | 21∣21 | 21∣24 |
|---|---|---|---|---|
| Number of people purchasing cigarette (y) | 870 | 900 | 930 | 960 |
Substitute ticket price as x = 18 into the equation of line of best fit
y = -3.7x + 1020
y = -3.7 × 25 + 1020 = 927.5 ≈ 928
928 people will attend the show if the ticket price is $18.
Practice Questions
**Q1: For the following data, the equation of the line of best fit is y = -3x + 100. Find how many people will buy cigarettes if the price is $20.
| Cigarette price (x) | 10∣10 | 10∣12 | 13∣13 | 13∣14 |
|---|---|---|---|---|
| Number of people purchasing cigarette (y) | 850 | 920 | 900 | 960 |
**Q2: For the following data, the equation of the line of best fit is y = -2x + 120. Find how many people will buy candy if the price of candy is $10.
| Candy price (x) | 8∣8 | 8∣10 | $14 |
|---|---|---|---|
| Number of people buying candy (y) | 180 | 120 | 140 |
**Q3: For the following data, the equation of the line of best fit is y = -3x + 800. Find how many people will attend the show if the ticket price is $14.
| Ticket price (x) | 2∣2 | 2∣5 | 8∣8 | 8∣10 |
|---|---|---|---|---|
| Number of people attending (y) | 80 | 90 | 110 | 140 |
**Q4: For the following data, the equation of the line of best fit is y = -5x + 1200. Find how many people will attend the concert show if the ticket price is $27.
| Concert ticket price (x) | 20∣20 | 20∣25 | 30∣30 | 30∣35 |
|---|---|---|---|---|
| Number of people attending concert (y) | 600 | 500 | 300 | 200 |
**Q5: For the following data, the equation of the line of best fit is y = -4.0x + 1060. Find how many people will attend the concert show if the ticket price is $25.
| Ticket price (x) | 17∣17 | 17∣20 | 23∣23 | 23∣26 |
|---|---|---|---|---|
| Number of people attending (y) | 740 | 700 | 660 | 620 |