Mean Deviation (original) (raw)
Last Updated : 4 Nov, 2025
The mean deviation (also known as Mean Absolute Deviation, or MAD) of the data set is the value that tells us how far each data point is from the center point of the data set. The center point of the data set can be the Mean, Median, or Mode. Thus, the mean of the deviation is the average of the absolute deviations of all data points from the chosen central value.
Example of Mean Deviation
Suppose we have to find the mean deviation of the given data set: {4, 5, 6, 7, 8}.
**Calculate Value (Mean):
Mean = (4 + 5 + 6 + 7 + 8)/5 = 6
- Now we **subtract the mean from each data set to obtain the deviation from the mean.
| Values | Absolute Deviation from Mean|value - mean| | | ------ | ------------------------------------------- | | 4 | 2 | | 5 | 1 | | 6 | 0 | | 7 | 1 | | 8 | 2 |
The above table can be depicted on a number line:
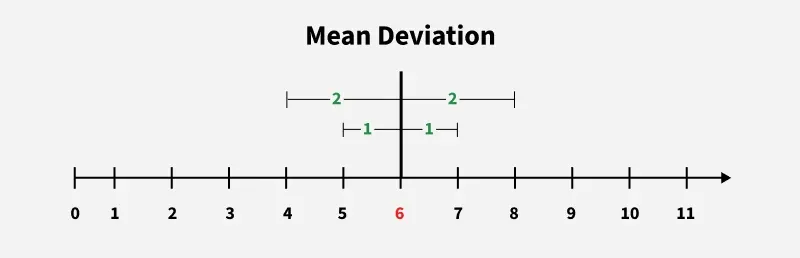
Mean Deviation
- **Sum of Absolute Deviations: 2 + 1 + 0 + 1 + 2 = 6
- **Mean Deviation: Mean Deviation = 6/5 = 1.2
This gives the mean deviation of the given data set.
**Key Concepts of Mean Deviation
Following are some important terms related to mean deviation:
**1) Central Tendency
- The central point of a dataset can be represented by the **Mean, **Median, or **Mode.
- Mean Deviation measures how far the data points are spread out from the central value.
**2) Absolute Deviation:
- The absolute deviation of a data point is the absolute difference between the data point and the central value (∣xi−central value∣∣__xi_−central value∣).
- Using absolute values ensures that deviations are always positive, regardless of direction.
**3) Mean of Deviations:
- The Mean Deviation is the average of all absolute deviations in the dataset.
Mean Deviation Formulas
There are various types of mean deviation formulas used depending upon the types of data given and the central point chosen for the given data set.

Where,
- ∑ – Summation
- xi – Observations
- μ – Mean
- n – Number of observations
Mean Deviation Formula for Ungrouped Data
For ungrouped data or data that is not properly arranged, that is, the given data is in raw form, the mean deviation is calculated using the formula,
**Mean Deviation = ∑ i = 1 n |x i - x̄| / n
Where,
- **x irepresents the ith observation
- **x̄ represents any central point (mean, median, or mode)
- **n represents the number of observations present in the dataset
**Mean Deviation for Discrete Frequency Distribution
In the discrete series, the data of each value is represented, and its frequency is represented in the next column of the table. The table added below shows the data in a discrete frequency distribution table.
| Wages | Number of Workers (Frequency) |
|---|---|
| 2500 | 7 |
| 3000 | 9 |
| 4000 | 5 |
| 4500 | 6 |
| 5000 | 3 |
The formula used to calculate the mean deviation in this type of data set is,
**Mean Deviation = ∑ i=1 n f i | x i - x̄ | / ∑ i=1 n f i
Where,
- **x irepresents the specific ith value,
- **x̄ represents any central point (mean, median, or mode), and
- **f i represents the frequency of each class interval.
**Mean Deviation for Continuous Frequency Distribution
In a continuous series, data is arranged in certain definite classes. The data items contained in classes lose their identity, and the individual items are merged into one or the other class groups. The classes have continuity, that is, the end of the first class is marked by the beginning of the next class. Thus, the name is a continuous series. For instance, the continuous series is depicted using the following data,
| Age Group | Frequency |
|---|---|
| 10-20 | 15 |
| 20-30 | 10 |
| 30-40 | 13 |
| 40-50 | 12 |
The formula used to calculate the mean deviation in this type of data set is,
**Mean Deviation = ∑ i=1 n | x i - x̄ | / ∑ i=1 n f i
Where,
- **x irepresents the specific ith value,
- **x̄ represents any central point (mean, median, or mode), and
- **f i represents the frequency of each class interval.
Mean Deviation about Mean
We can easily calculate the mean deviation from the mean of the given dataset. The mean of the data set is simply the arith mean also called the average of the data set. It is calculated by taking the sum of all observations divided by the number of observations.
The formula used to calculate the mean deviation about the mean of the data set is,
**For Ungrouped Data,
**Mean Deviation = ∑ i=1 n | x i - x̄ | / n
Where **x̄ = (x 1 + x 2 + x 3 **+ ... + x n )/n
**For Continuous and Discrete Frequency Distribution,
**Mean Deviation = ∑ i=1 n | x i - x̄ | / ∑ i=1 n f i
Where **x̄ = ∑ i=1 n x i f i / ∑ i=1 n **f i
The middle point of the data set, when arranged in ascending or descending order, is called the median of the data set. It is the middle value of the data set that divides the data set into two equal halves. The formula to calculate the mean deviation of the data set about the mean is,
**For Ungrouped Data,
**Mean Deviation = ∑ i=1 n | x i - M | / n
Where **M represents the middle point or median of the data set and is calculated as,
- For n = odd terms, M = [(n + 1)/2]th observation
- For n = even terms, M = [(n/2)th + (n/2 + 1)th] / 2
**For Discrete Frequency Distribution,
**Mean Deviation = ∑ i=1 n f i | x i - M | / ∑ i=1 n **f i
Where **M represents the middle point or median of the data set, and is calculated in the same way as above.
**For Continuous Frequency Distribution,
**Mean Deviation = ∑ i=1 n f i | x i - M | / ∑ i=1 n **f i
Where **M represents the middle point or median of the data set and is calculated as,
**M = l + {[∑ i=1 n **f i /2 - cf] / f} × h
Where,
- **cf is the cumulative frequency of the class preceding the median class,
- **l is the lower value of the median class,
- **h is the length of the median class, and
- **f is the frequency of the median class.
Mean Deviation about Mode
The term with the highest frequency in the dataset is the mode of the dataset. The formula to calculate the mean deviation of the data set about the mode is,
**For Ungrouped Data,
**Mean Deviation = ∑ i=1 n | x i - M | / n
Where **M represents the mode of the data set.
**For Discrete Frequency Distribution,
**Mean Deviation = ∑ i=1 n f i | x i - M | / ∑ i=1 n **f i
Where **M represents the mode of the data set.
**For Continuous Frequency Distribution,
**Mean Deviation = ∑ i=1 n f i | x i - M | / ∑ i=1 n **f i
where, M represents the mode of the data set and is calculated as,
**Mode = l + [(f - f 1 ) / (2f - f 1 - f 2 )] × h
Where,
- **l is the lower value of the modal class,
- **h is the size of the modal class,
- **f is the frequency of the modal class,
- **f 1is the frequency of the class preceding the modal class, and
- **f 2is the frequency of the class succeeding the modal class.
**How to Calculate Mean Deviation?
**Step 1: Calculate the value of the mean, median, or mode of the series.
**Step 2: Calculate the absolute deviations about the mean, median, or mode.
**Step 3: Multiply the deviations of the given data set with their respective frequency. It is required if the frequency of the data is given.
**Step 4: Find the sum of all the deviations and divide it by the number of observations to get the mean deviation.
**Example: Find the mean deviation of the given data about their mean, {4, 6, 7, 3, 5, 5}.
**Solution:
**Step 1: Find the mean of the given data.
Mean = (4 + 6 + 7 + 3 + 5 + 5) / 6 = 30 / 6 = 5
**Step 2: Find the absolute deviation
Given Data Set Absolute Deviation of Mean 4 4-5 = |-1 6 6-5 = |1 7 7-5 = |2 3 3-5 = |-2 5 5-5 = |0 5 5-5 = |0 **Step 3: Find the mean deviation of the absolute value so obtained.
**Mean Deviation = (1 + 1 + 2 + 2 + 0 + 0)/6 = 6/6 = 1
Thus, the mean deviation from the mean of the given data set is 1.
Mean Deviation vs Standard Deviation
The basic difference between the mean deviation and the standard deviation is discussed in the table below.
| Mean Deviation | Standard Deviation |
|---|---|
| All the central points (mean, median, and mode) are used to find the mean deviation. | The mean is only used to find the standard deviation. |
| The absolute value of the deviation is used to find the mean deviation. | The square of the deviation is used to find the standard deviation. |
| Mean deviation is a less frequently used data measure. | Standard Deviation is a highly used data measure that is used to find various central measures. |
Merits and Demerits of Mean Deviation
Mean deviation is a highly used data measure, and the various merits and demerits of the mean deviation are,
Merits of Mean Deviation
- Mean deviation is very easily calculated and easy to understand.
- Change in extreme values does not affect the mean deviation drastically.
- Its gets fluctuated the least as compared to other statistical measures.
- We use this measure in various business and economic activities.
Demerits of Mean Deviation
- This measure of central tendency is not rigid and we can use the mean, median or mode of any central value to find the mean deviation.
- It uses absolute values and thus inaccuracies in the data are highly incurred.
- Various studies do not this measure to find the deviation in the data.
**Also Check:
**Solved Examples of Mean Deviation
**Example 1: Find the mean deviation of the following data: 7, 5, 1, 3, 6, 4, 10.
**Solution:
For Finding the mean deviation,
First, calculate the mean value of the given data
Mean = Sum of all the observations / Number of observations
= \frac{7 \ + \ 5 \ + \ 1 \ + \ 3 \ + \ 6 \ + \ 4 \ + \ 9}{7}
Mean = 5.14 ≅ 5
Now finding the absolute deviation.
Given Value Absolute Deviation of Mean 7 |7 - 5 = 5 |5 - 5 = 1 |1 - 5 = 3 |3 - 5 = 6 |6 - 5 = 4 |4 - 5 = 10 |10 - 5 = Further the mean of Absolute Values
= 2, 0, 4, 2, 1, 1, 5
Mean = \frac{2 \ + \ 0 \ + \ 4 \ + \ 2 \ + \ 1 \ + \ 1 \ + \ 5}{7}
Mean Deviation = 2.14
Therefore,
Mean deviation for 7, 5, 1, 3, 6, 4, 10 is 2.14
**Example 2: Find the mean deviation of the following data: 11, 9, 7, 3, 2, 8, 10, 12, 15, 13.
**Solution:
For Finding the mean deviation,
First, calculate the mean value of the given data
Mean = = \frac{11 \ + \ 9\ + \ 7 \ + \ 3 \ + \ 2 \ + \ 8 \ + \ 10 \ + \ 12 \ + \ 15 \ + \ 13}{10}
Mean = 9
Now finding the absolute deviation.
Given Value Absolute Deviation of Mean 11 |11 - 9 = 9 |9 - 9 = 7 |7 - 9 = 3 |3 - 9 = 2 |2 - 9 = 8 |8 - 9 = 10 |10 - 9 = 12 |12 - 9 = 15 |15 - 9 = 13 |13 - 9 = Further find the mean of these values obtained are 2, 0, 2, 6, 7, 1, 1, 3, 6, 4.
Mean Deviation ⇒\frac{2 \ + \ 0 \ + \ 2 \ + \ 6 \ + \ 7 \ + \ 1 \ + \ 1 \ + \ 3 \ + \ 6 \ + \ 4 }{10}\\=\frac{32}{10}
⇒ Mean = 3.2
Therefore, Mean deviation for 11, 9, 7, 3, 2, 8, 10, 12, 15, 13 is 3.2.
**Example 3: Find the mean deviation of the following data table:
| Class Interval | Frequency |
|---|---|
| 5-15 | 8 |
| 15-25 | 12 |
| 25-35 | 6 |
| 35-45 | 4 |
**Solution:
The mean of the following data is,
Class Interval Frequency(fi) Mid Point(xi) fixi 5-15 8 10 80 15-25 12 20 240 25-35 6 30 180 35-45 4 40 160 ∑fi = 30 ∑fixi = 660 x̄ = ∑fixi / ∑fi = 660/30 = 22
| Class Interval | Frequency(fi) | Mid Point(xi) | |xi - x̄| | | -------------- | ----------------- | ------------- | ----------- | | 5-15 | 8 | 10 | 12 | | 15-25 | 12 | 20 | 2 | | 25-35 | 6 | 30 | 8 | | 35-45 | 4 | 40 | 18 | | ∑fi = 30 | ∑|xi - x̄| = 40 | | |
Mean Deviation = 40/30 = 1.33