Multimodal Distribution (original) (raw)
Last Updated : 23 Jul, 2025
**Multimodal distribution is a probability distribution with more than one peak or mode, indicating the presence of multiple groups within the data. Unlike unimodal distributions, which have a single peak, multimodal distributions are common in real-world data where different subpopulations or distinct processes influence the outcomes.
In this article, we will discuss what multimodal distributions are, how to spot them in your data, ways to analyze and understand them, and some real-world examples where they are commonly found, like in finance, biology, and social studies.
Table of Content
- What is a Multimodal Distribution?
- Types of Multimodal Distributions
- What Causes Multimodal Distributions?
- How to Analyze Multimodal Distributions?
- Examples on Multimodal Distribution
- FAQs
What is a Multimodal Distribution?
A multimodal distribution is defined as a distribution with two or more distinct peaks or modes. The modes are the values at which the probability density function (PDF) of the distribution reaches its local maxima. Mathematically, if a distribution f(x) has multiple local maxima it is considered multimodal.
Examples of Multimodal Distributions
Some examples of multimodal distributions includes:
- **Exam Scores: A classroom where students are divided into the two groups based on the different teaching methods may show two peaks in the distribution of exam scores.
- **Traffic Flow: The Traffic volume data collected at different times of the day can show multiple peaks corresponding to the rush hours and off-peak hours.
Types of Multimodal Distributions
Some of the common types of multimodal distributions are:
- Bimodal Distribution
- Trimodal Distribution
- Polymodal Distribution
Bimodal Distribution
A bimodal distribution has two distinct peaks or modes indicating the presence of the two different subgroups within the dataset.
- Example: The distribution of heights in the mixed-gender group.
- Solution: Identify the two modes and analyze each subgroup separately to understand their characteristics.
Trimodal Distribution
A trimodal distribution has three distinct peaks suggesting the data can be segmented into the three different subgroups.
- Example: The distribution of the test scores where students are grouped by the proficiency levels.
- Solution: The Segment the data into the three groups and analyze the underlying causes for the each peak.
Polymodal Distribution
A polymodal distribution has the more than two modes indicating the multiple subgroups within the data.
- Example: The distribution of the ages in the community event with the activities tailored to children, adults and seniors.
- Solution: The Classify the data into the respective age groups and examine the factors contributing to the each mode.
What Causes Multimodal Distributions?
The Several factors can lead to the multimodal distributions:
- Mixture of Different Populations: When data is collected from the multiple groups with the different characteristics.
- Seasonal or Temporal Effects: The Variations in the data due to the time-based factors such as the sales data during the different seasons.
- Multiple Underlying Processes: When a phenomenon is influenced by the several different processes or conditions.
- Natural Variability: The Intrinsic differences in the data due to the natural causes such as the genetic diversity.
How to Analyze Multimodal Distributions?
- Visual Inspection: Use histograms or density plots to the identify multiple peaks in the data.
- Cluster Analysis: The Apply clustering techniques to the group data points based on the similarity.
- Statistical Tests: Perform the tests like the Hartigan's Dip Test to the statistically confirm the presence of the multiple modes.
- Segmentation: The Divide the data into the segments corresponding to the each mode and analyze them separately.
- Parameter Estimation: The Use models like Gaussian Mixture Models (GMM) to the estimate the parameters of the each distribution component.
Examples on Multimodal Distribution
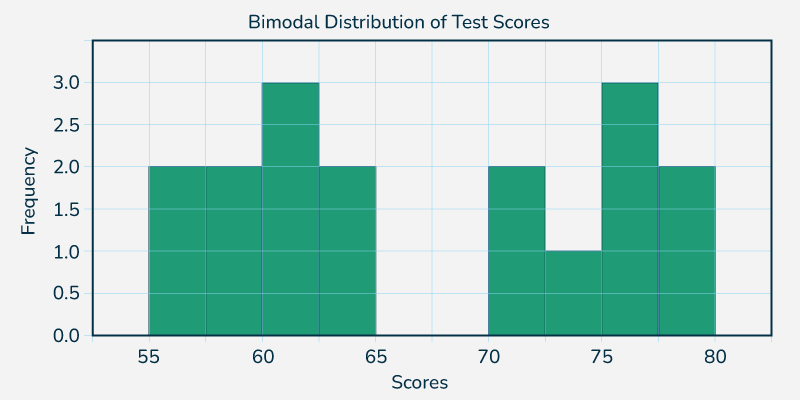
**Example 1: Bimodal Distribution of Test Scores
Dataset: 55, 57, 58, 59, 60, 60, 62, 63, 64, 70, 72, 74, 75, 76, 77, 78, 80
**Solution:
Step 1: Create a histogram or frequency plot of the data.
Step 2: Identify peaks.
Graph:
Interpretation: The data shows two distinct peaks around 60 and 75. Hence, the distribution is bimodal.
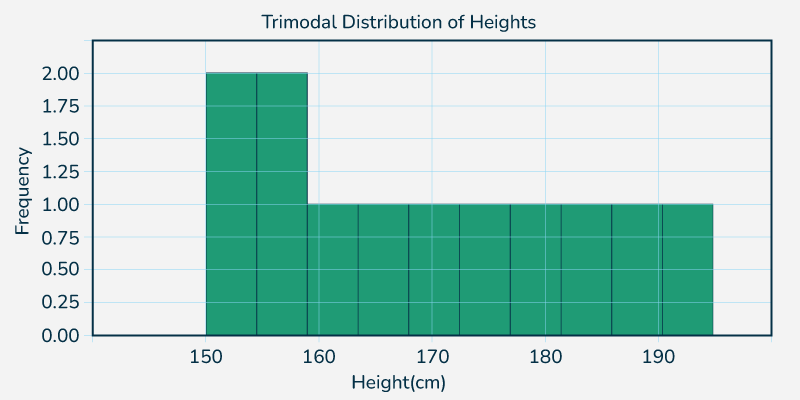
**Example 2: Trimodal Distribution of Heights
Dataset: 150, 152, 155, 157, 160, 165, 170, 175, 180, 185, 190, 195
**Solution:
Step 1: Plot the data to the visualize the distribution.
Step 2: Identify the modes.
Graph:
Interpretation: The data shows peaks around 160, 175 and 190 making it trimodal.
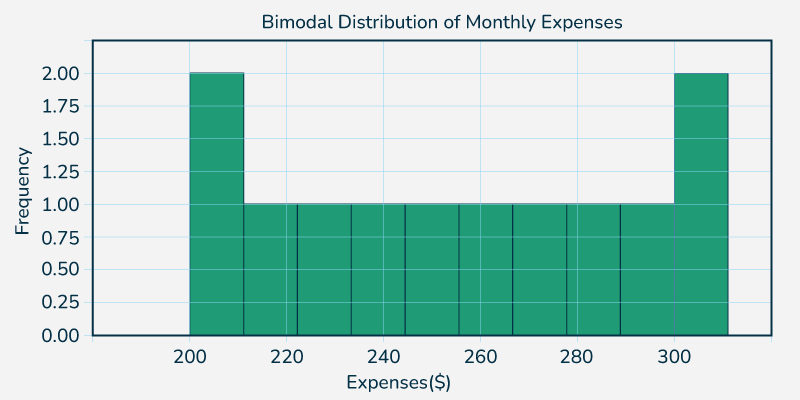
**Example 3: Bimodal Distribution of Monthly Expenses
Dataset: 200, 210, 220, 230, 240, 250, 260, 270, 280, 290, 300, 310
**Solution:
Step 1: Create a frequency plot.
Step 2: Identify the distinct peaks.
Graph:
Interpretation: The Peaks are visible around 240 and 280 indicating a bimodal distribution.
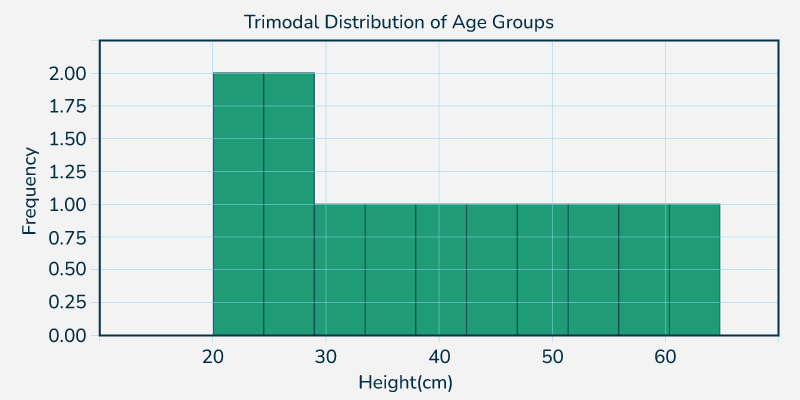
**Example 4: Trimodal Distribution of Age Groups
Dataset: 20, 22, 25, 27, 30, 35, 40, 45, 50, 55, 60, 65
**Solution:
Step 1: Plot the histogram.
Step 2: Locate the modes.
Graph:
Interpretation: The Peaks around 30, 45 and 60 indicate a trimodal distribution.
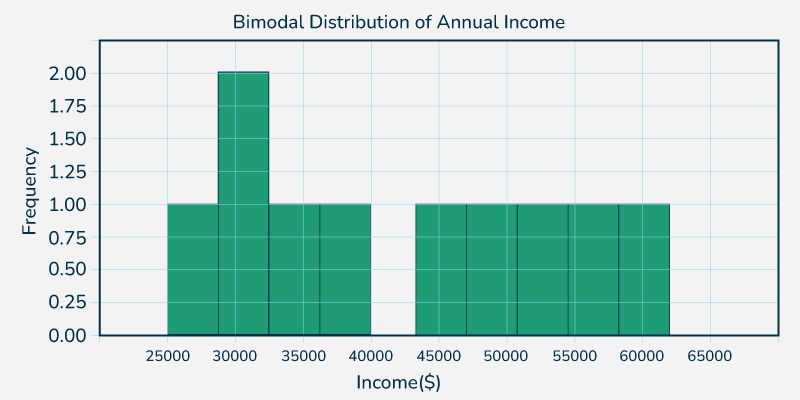
**Example 5: Bimodal Distribution of Annual Income
Dataset: 25k, 30k, 32k, 35k, 40k, 45k, 50k, 55k, 60k, 65k
**Solution:
Step 1: Construct a histogram.
Step 2: Identify the peaks.
Graph:
Interpretation: The data shows two peaks around 35k and 55k making it bimodal.
Practice Questions
**Question 1: Given the dataset [30, 32, 32, 34, 36, 36, 38, 40, 40, 42, 42, 44] identify if the distribution is unimodal, bimodal, or multimodal.
**Question 2: A dataset of weights (in kg) from three different age groups: [50, 52, 55, 60, 65, 70, 75, 80, 85, 90, 95, 100, 105, 110, 115, 120]. Determine if the distribution is unimodal or multimodal.
**Question 3: Analyze the following data for the number of hours spent on homework: [1, 2, 2, 3, 4, 4, 5, 6, 6, 7, 8, 9, 10]. What type of distribution does it represent?
**Question 4: Given the dataset of annual salaries in thousands of dollars [20, 22, 24, 26, 28, 30, 32, 34, 36, 38, 40, 42] determine the distribution type and describe the number of modes.
**Question 5: Identify the distribution type for the following dataset of daily temperatures (in °C) [15, 16, 17, 18, 18, 19, 20, 21, 22, 22, 23, 24, 25].
**Question 6: For the dataset [5, 10, 15, 20, 25, 30, 35, 40, 45, 50] determine if it is unimodal or multimodal.
**Question 7: Analyze the dataset of student grades [50, 55, 55, 60, 60, 65, 70, 75, 75, 80] to the determine if it shows a unimodal or bimodal distribution.
**Question 8: A dataset of monthly sales figures is given as [1000, 1500, 2000, 2500, 3000, 3500, 4000, 4500, 5000, 5500, 6000]. What is the distribution type?
**Question 9: Identify the distribution type for the dataset representing heights of individuals in a study: [160, 165, 170, 175, 180, 185, 190, 195, 200].
**Question 10: Given the dataset of ages of a group of people [25, 30, 35, 40, 45, 50, 55, 60, 65, 70] determine if it is unimodal or multimodal.
Conclusion
One of the fundamental ideas in the statistics that reveals the richness and diversity of the data is the multimodal distribution. The Data scientists and statisticians can learn a great deal about the underlying processes and subpopulations influencing the data by the comprehending and evaluating these distributions. To ensure a thorough understanding of this crucial subject this article offers a core understanding of the multimodal distributions including their types, properties and practical applications.
**Read More,