Polynomials in One Variable (original) (raw)
Last Updated : 16 Apr, 2026
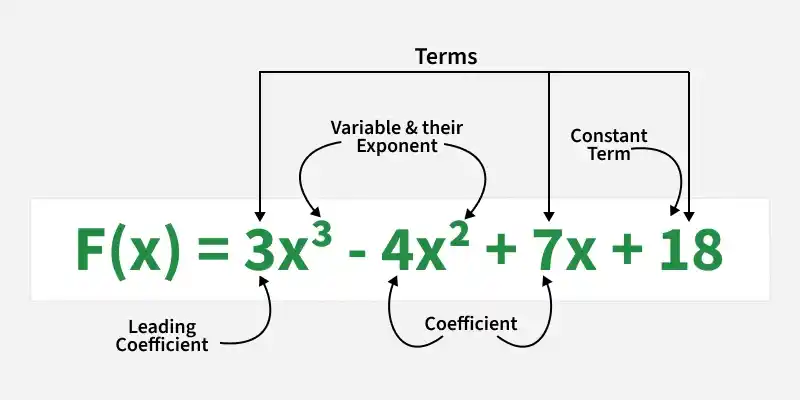
A polynomial is an algebraic expression made up of variables, constants, coefficients, and exponents, combined using operations such as addition, subtraction, and multiplication.
A Polynomial in one variable is an algebraic expression that contains only one variable (such as x) along with numbers and powers of that variable.
- The powers of the variable must be non-negative integers (0, 1, 2, 3, 4, 5, 6...).
- The degree of polynomial in one variable is the highest exponent of the variable in the expression.
**For example:
- 3x3 - 4x2 + 7x + 18 (degree: 3)
- y + 2y2 - 4 (degree: 2)
- a + a2 + 3a5 (degree: 5)
Since only one variable is used, this expression is called a polynomial in one variable.
Classification of Polynomials Based on Degree
Polynomials in one variable can be classified based on their degree.
1. Constant Polynomial
A constant polynomial has no variable or the variable has power 0. Its degree is 0.
Example: P(x) = 5
2. Linear Polynomial
A linear polynomial has the highest power of the variable equal to 1. The general form is: ax + b
Example: P(x) = 3x + 2
3. Quadratic Polynomial
A quadratic polynomial has the highest power of the variable equal to 2. The general form is: ax2+ bx + c
Example: P(x) = x2 + 4x + 1
4. Cubic Polynomial
A cubic polynomial has the highest power of the variable equal to 3. The general form is: ax3 + bx2 + cx + d
Example: P(x) = 2x3 + x2 − 5x + 3
5. Higher Degree Polynomials
Polynomials with degree 4 or more are called higher-degree polynomials. Their names are based on the degree (quartic for degree 4, quintic for degree 5, etc.).
Example: P(x) = x4 + 2x3 + x + 7
Graphical Representation of Polynomials
The Polynomials can be represented on the graph paper by plotting it point by point.
**Example: Plot the graph for the polynomial f(x) = 2x.
First, create a table by taking different values of x for the function f(x)=2x
| x | 0 | 1 | 2 | 3 | -1 |
|---|---|---|---|---|---|
| f(x) | 0 | 2 | 4 | 6 | -2 |
Now, plot the Graph of polynomial: f(x) = 2x
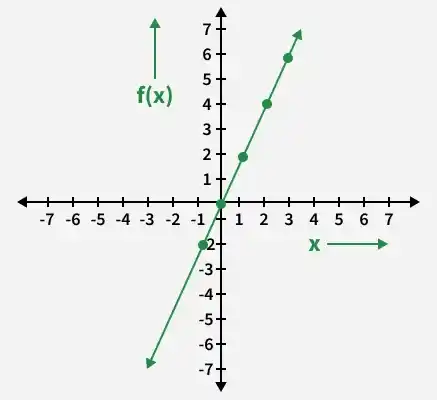
The point(on the X-axis) where the graph of polynomial cuts the X-axis is called zero of the polynomial.