Positively Skewed Distribution (original) (raw)
Last Updated : 20 Aug, 2024
**Positively Skewed Distribution: When you analyze any kind of data, it's important to understand what the data set can reveal. If you deal with sales reports, marketing insights, or other key business data, knowing what a positively skewed distribution looks like can be very helpful.
This type of data distribution is common in many situations and can provide valuable insights about the data you’re working with. In this article, we'll explore what it means when your data is positively skewed and look at some examples, causes, characteristics and central tendencies of this kind of distribution.
Table of Content
- What is a Positively Skewed Distribution?
- Positively Skewed Distribution: Characteristics
- Positively Skewed Distribution: Solved Example
- Positively Skewed Distribution: Causes
- Positively Skewed Distribution: Mean and Median
- Positively Skewed Distribution: Central Tendency
- Conclusion
- FAQs on Positively Skewed Distribution
What is a Positively Skewed Distribution?
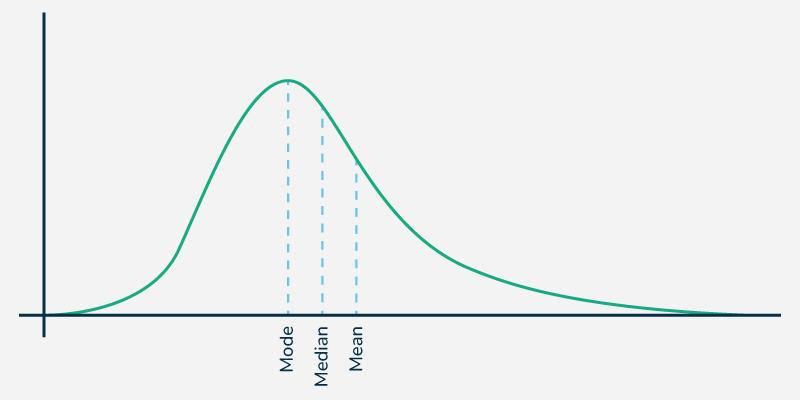
A positively skewed distribution is one where most of the data is grouped on the left side, with a long tail stretching out to the right. In this type of distribution, the mean, median, and mode are all positive values. It's also called a right-skewed distribution because the mean tends to be on the right side of the median.
Characteristics of Positively Skewed Distribution
Some of the common characteristics of positively skewed distribution are:
- A positively skewed distribution happens when the mean, median, and mode of the data are all above zero. This means the data is mostly grouped on one side, with a long tail extending to the right.
- Several factors can cause this type of distribution, such as uneven data distribution, similar groups, favorable outcomes, and predictive analysis.
- In a positively skewed distribution, the mean is higher than the median. This occurs because the data leans toward lower values, which pulls the mean in that direction, while the median stays closer to the center of the data.
Positively Skewed Distribution: Solved Example
Income distribution is considered positively skewed if a larger portion of the population falls into the average or lower-income groups, while only a few are in the high-income bracket. In such cases, the mean income is usually higher than the median income.
Here is the data from the sample. The first column lists the income categories, and the second column shows the number of people in each income group. Next, you can calculate the mean, median, and mode to determine if this distribution is positively skewed.
| Income ($) | People |
|---|---|
| $ 10,000 | 100 |
| $ 9,000 | 150 |
| $ 8,000 | 500 |
| $ 7,000 | 1000 |
| $ 6,000 | 1500 |
| $ 5,000 | 2000 |
| $ 4,000 | 3000 |
| $ 3,000 | 4000 |
| $ 2,000 | 5000 |
| $ 1,000 | 6000 |
Calculation of the Mean, Median, and Mode
**1. Mean:
To find the mean, you add up all the income values and divide by the number of values.
\text{Mean} = \frac{(100 + 150 + 500 + 1,000 + 1,500 + 2,000 + 3,000 + 4,000 + 5,000 + 6,000)}{10} = 2,325
**2. Median:
The median is the middle value when the numbers are arranged in order. Since there are 10 values:
\text{Median} = \frac{\text{5th value} + \text{6th value}}{2} = \frac{1,500 + 2,000}{2} = 1,750
**3. Mode:
The mode is the most frequently occurring value. In this case, it’s the lowest value, which is 150.
**Therefore, \text{Mean} > \text{Median} > \text{Mode} \quad \text{or} \quad 2,325 > 1,750 > 150
This pattern, where the mean is greater than the median, indicates a positively skewed distribution. Most people fall into the lower-income category, which is also true for the example given.
Positively Skewed Distribution: Causes
The following is the list of causes for Positively Skewed Distribution:
- **Inequality in Distribution: People earn different amounts of money based on their working capacity, opportunities, and other factors. This unequal distribution of income is a major reason for a positively skewed distribution.
- **Homogeneous Groups: In a positively skewed distribution, outcomes are often similar within groups. For example, in income distribution, most people might fall into the lower or middle-income brackets, making the earnings within these groups quite similar.
- **Desirable Returns: In finance, when returns are favorable, they often result in a positively skewed distribution. This means the chances of making a profit are higher than the chances of a loss.
- **Predictive Approach: Using a predictive approach to group data can also lead to a positively skewed distribution.
Positively Skewed Distribution: Mean and Median
In a positively skewed distribution, the mean (average) is higher than the median (middle value) because most of the data is concentrated on the lower side. The mean is calculated by adding all the values and dividing by the number of values, while the median is the middle number when the data is arranged in order.
For example, consider the numbers 50, 51, 52, and 59. This set is positively skewed because the data is spread out with higher numbers.
- **Mean: The average of these numbers is 53 (calculated as (50+51+52+59)/4).
- **Median: The median is the middle value, which is 51.5 (calculated as the average of the 2nd and 3rd values, (51+52)/2).
Since the mean (53) is greater than the median (51.5), the data is positively skewed.
Positively Skewed Distribution: Central Tendency
Central tendency refers to the mean, median, and mode of the distribution. In a normally distributed data set, these three values are equal. However, in a positively skewed distribution, the relationship is as follows:
\text{Mean} > \text{Median} > \text{Mode}
- **Mean: The average of all the values.
- **Median: The middle value in the data.
- **Mode: The value that appears most frequently.
In a positively skewed distribution, the data is more concentrated on the lower side, making the mean higher than the median and mode.
Conclusion
A positively skewed distribution occurs when most data is on the lower side, creating a longer curve to the right. In such distributions, the mean is greater than the median. This often happens in situations like income distribution, where most people earn in the lower to middle range, causing the data to be positively skewed. Uneven distribution of data is the key factor in determining whether the distribution is positive or negative.