Sample: Definition, Types, Formula & Examples (original) (raw)
Last Updated : 14 May, 2025
Sampling is a fundamental concept in statistics that helps us understand large populations without having to study every single individual. In this article, we'll break down the idea of a sample, explain the different types, show how to calculate it, and provide easy-to-understand examples. Whether you're a student, data analyst, or researcher, this guide will give you a strong foundation.
A sample is a subset of individuals selected from a larger population. The goal is to use the sample to make inferences or draw conclusions about the whole population.
Key Terms:
- **Population: The entire group you want to study.
- **Sample: A smaller group taken from the population.
- **Sampling: The process of selecting a sample.
Why Use Samples?
- Studying an entire population is often expensive and time-consuming.
- Samples save time and resources.
- If selected properly, a sample can provide accurate insights.
**Example:
Suppose a company wants to know what employees think about a new policy. Instead of surveying all 10,000 employees, they can survey 1,000 randomly selected employees.
Types of Sampling Methods
There are two major categories: Probability Sampling and Non-Probability Sampling.
1. Probability Sampling
In this method, every member of the population has a known and equal chance of being selected.
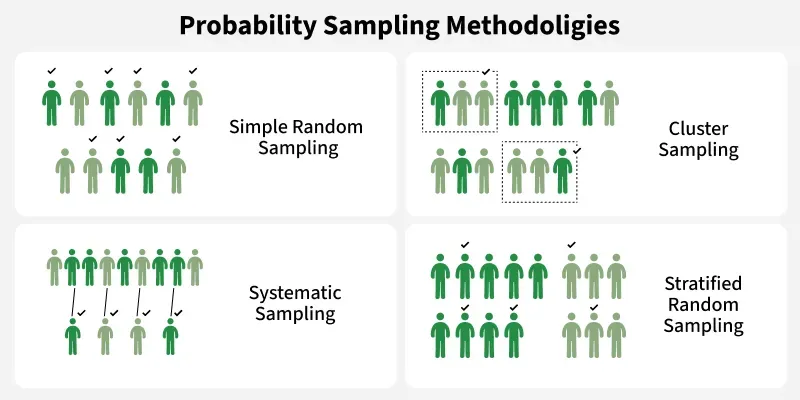
Probability Sampling
**a. Simple Random Sampling
- Every individual has an equal chance.
- Often done using random number generators.
**Example: Picking 50 names out of a hat from a list of 500.
**b. Stratified Sampling: The population is divided into groups (strata), and random samples are taken from each group.
**Example: Dividing students by grade level and selecting random students from each grade.
**c. Systematic Sampling: Select every kth individual from a list.
**Example: Every 10th person on an attendance sheet.
**d. Cluster Sampling: The population is divided into clusters, some clusters are randomly selected, and all members in those clusters are studied.
**Example: Randomly picking 5 schools and surveying all students in those schools.
2. Non-Probability Sampling
In this method, not every individual has a chance of being selected.
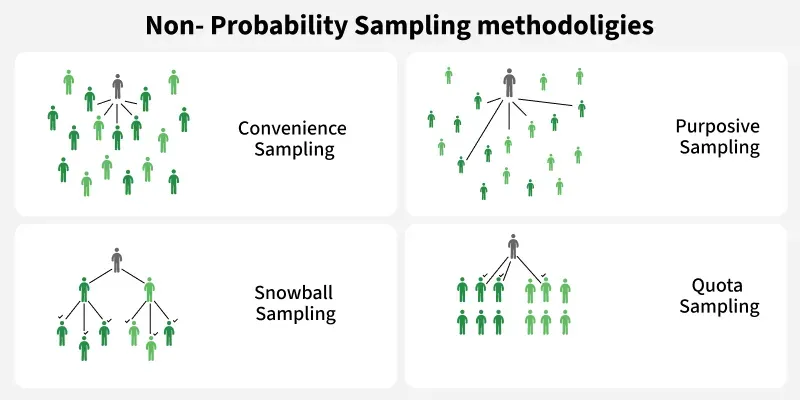
**a. Convenience Sampling: Select individuals who are easiest to reach.
**Example: Surveying people at a nearby coffee shop.
**b. Purposive Sampling: The researcher selects individuals based on their judgment.
**Example: Interviewing only senior managers for insights about company policy.
**c. Snowball Sampling: Existing subjects help recruit more subjects.
**Example: Asking participants to refer others in a study about a rare disease.
**d. Quota Sampling: Like stratified sampling but not random; select a fixed number from each group.
**Example: Choosing 20 males and 20 females from a group, regardless of randomness.
Characteristics of a Good Sample
- **Representative: Should reflect the population accurately.
- **Unbiased: Free from systematic errors.
- **Adequate Size: Large enough to draw meaningful conclusions.
- **Randomness: Ensures each member of the population has a fair chance.
How to Apply the Sample Size Formula
To calculate the sample size accurately, follow these key steps:
Step-1: Determine Key Inputs
Start by identifying your population size, which is the total group you're studying. For small groups (like employees in a small company), precise numbers matter. For large populations (like a country), estimates are usually acceptable.
Step-2: Choose a Margin of Error (e)
This is the amount of error you're willing to tolerate, expressed as a percentage. A smaller margin (e.g., ±3%) means more accuracy but requires a larger sample.
Step-3: Set a Confidence Level (Z-score)
Common levels are 90%, 95%, or 99%, which correspond to Z-scores like 1.645, 1.96, and 2.576, respectively. A 95% confidence level means you’re 95% sure the real value lies within your margin of error.
Step-4: Estimate the Standard Deviation (p)
If you're unsure, use 0.5 (50%), which gives the most conservative sample size.
Step-5: Apply the Formula
Use this formula for infinite populations:
n = \frac{Z^2 \cdot p \cdot (1-p)}{e^2}
For finite populations, adjust it as:
\text{Adjusted } n = \frac{n}{1 + \frac{n - 1}{N}}
**Example: Estimate the proportion of people who prefer tea over coffee. You want 95% confidence, with a margin of error of 5%, and no prior estimate, so use p = 0.5:

Example of sample size formula
So, you need at least 385 people in your sample.
Sampling Error
This is the difference between the result from the sample and the actual result from the entire population.
Types of Errors
- **Sampling Error: Occurs by chance when a sample doesn't represent the population well.
- **Non-Sampling Error: Mistakes in data collection, recording, or processing.
Real-Life Applications
- **Healthcare: Clinical trials test new drugs on a sample of patients.
- **Politics: Polls predict election results using samples.
- **Marketing: Companies survey customers to learn about satisfaction.
- **Education: Researchers study the performance of a sample of students.