Skewness Formula (original) (raw)
Last Updated : 23 Jul, 2025
**Skewness is a measure used in statistics to understand a data set's symmetry or lack thereof. It helps determine whether the data is more spread out on one side of the mean than the other. A data set can be skewed either to the left (negative skew) or the right (positive skew), or it can be symmetrical (zero skew).
The **measure of skewness tells us the direction and the extent of skewness. In a symmetrical distribution, the mean, median, and mode are identical. The more the mean moves away from the mode, the larger the asymmetry or skewness.
Before learning, let's learn more about Mean, Median, and Mode first.
Table of Content
**Mean
Mean is the average of the numbers in the data distribution, It is calculated by adding up all the values in the dataset and dividing the sum by the number of values in the dataset.
**Mean= Sum of all values in Dataset / Total number of values
**Example: Find the mean of a dataset of exam scores: 70, 80, 85, 90, and 95.
**Solution:
Mean = (70 + 80 + 85 + 90 + 95) / 5 = 84
So the mean of this dataset is 84.
- When arranging all the data in order (ascending and descending), the comes in the middle of the data is called the median.
- **Median is the middle value of a dataset when the values are arranged in order from smallest to largest.
**Examples of Odd Numbers in the Dataset
**Example 1: Find the median of a dataset of exam scores: 70, 85, 80, 95, 90
**Solution:
Firstly arrange all no. in order from smallest to largest: 70, 80, 85, 90, 95.
The mid value is 85. so, the median is 85.
**Example 2: Find the median of a dataset: 5, 10, 15, 20, 25.
**Solution:
Firstly arrange all no. in order from smallest to largest: 5, 10, 15, 20, 25.
The mid value is 15. so, the median is 15.
**If there are an even number of values in the dataset, the median is calculated by taking the average of the two middle values.
**Examples of Even Numbers in the Dataset
**Example 1: Find the median of a dataset of exam scores: 70, 80, 85, 90.
**Solution:
The median is calculated as (80 + 85) / 2 = 82.5
So the median of this dataset is 82.5.
**Example 2: Find the median of a dataset: 2, 4, 6, 8, 10, 12.
**Solution:
Firstly, we need to find the middle two numbers. So, 6, and 8 are mid values of the dataset
Median = (6 + 8) / 2 = 7
So the median of this dataset is 7.
**Mode
The most frequently used number in data is called the mode of the data.
**Example 1: We have a data set representing the number of pets owned by 10 people: 3, 1, 0, 2, 1, 1, 4, 2, 2, 1. Find the mode.
**Solution:
So, the value that appears most frequently in the data set is 1. The value 1 appears four times. Therefore, the mode of this data set is 1.
Skewness Formula
The skewness formula is discussed in the image below.

Skewness Formula
Type of Skewness
Various types of skewness used in mathematics are,
- Positive Skewness
- Negative Skewness
- Zero Skewness
Positive Skewness
- Positive Skewness means the tail on the right side of the distribution is longer. The mean and median will be greater than the mode.
- Condition for positive skewness = **Mean > Median >Mode
The positive curve of skewness is shown in the image below.

Graph of Positive Skew
Let's take an example of the income distribution where a few people earn very high incomes and the majority earn lower incomes. So, this is often positively skewed. Analyzing skewed data can provide valuable insights into the underlying causes and potential solutions or interventions.
Negative Skewness
- Negative Skewness means the tail of the left side of the distribution is longer than the tail on the right side. The mean and median will be less than the mode.
- The condition for negative skewness is **Mode > Median > Mean
The curve shows negative skewness in the image below,
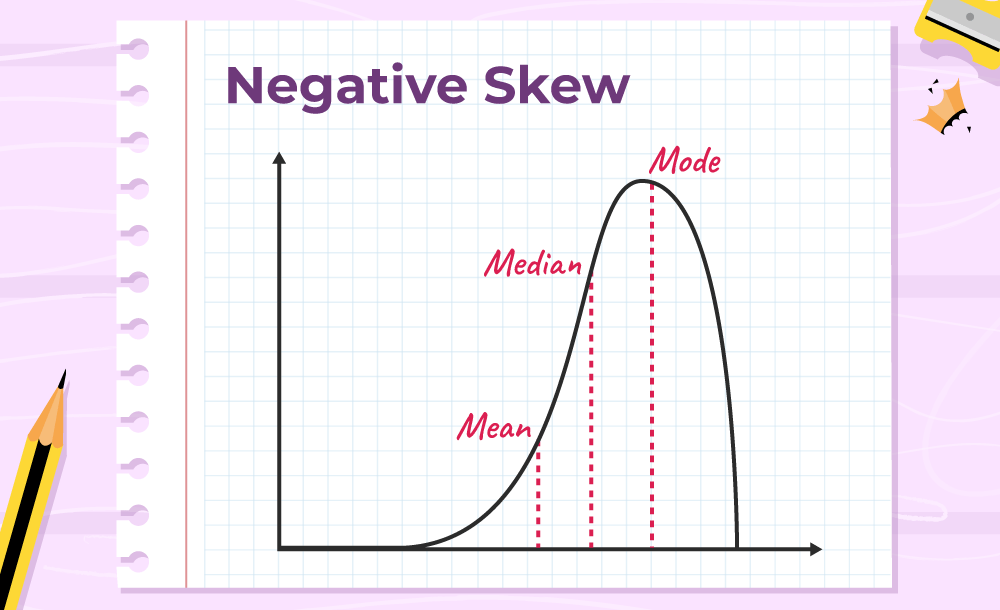
Graph of Negative Skew
Let's take an example of a match; during the match, most of the players of a particular team scored runs above 50, and only a few of them scored below 10. In such a case, the data is generally represented with the help of a negatively skewed distribution. This data is helpful to analyze the game's performance.
Zero Skewness
- It is also known as a "symmetric distribution". It signifies that the distribution of data is evenly distributed around the mean, with no long tails on either end of the distribution.
- The condition for zero skewness is **Mean = Mode = Median
The curve for zero skews is shown in the image below.

Graph of Zero Skew
Methods to Measure Skewness
Skewness can be measured using Karl Pearson's Coefficient of Skewness.
Karl Pearson's Coefficient of Skewness
The formula for measuring Skewness using Karl Pearson's Coefficient is discussed below in the image,

Karl Pearson Coefficient of Skewness
Karl's**onditions
- Mean = Mode = Median, then the coefficient of skewness is zero for symmetrical distribution.
- Mean > Mode, then the coefficient of skewness will be positive.
- Mean < Mode, then the coefficient of skewness will be negative.
Karl's person`s coefficient of skewness has a positive sign for the positively skewed and a negative sign for the negatively skewed.
**Read More,
- Ccoefficient is Statistics
- Coefficient of Skewness
Solved Examples on Skewness Formula
**Example 1: Find the skewness for the given Data ( 2,4,6,6)
**Solution:
Mean of Data = (2 + 4 + 6 + 6) / 4
= 18 / 4
= 4.5
Number of terms (n) = 4 (even)
Median of Data = {[n / 2]th + [n / 2 + 1]th}/2 term
= [(4 /2)th term + (4/2 +1)th term] / 2
= [2nd term + 3rd term] / 2
= [4+6]/2
= 10/2Median of Data = 5
Mode of Data = Highest Frequency term = 6 (frequency 2)
S.D. = √[(4.5-2 )2 + (4.5-4)2 + (4.5-6)2 + (4.5-6)2/4]
= √[(6.25 + 0.25 + 2.25 + 2.25) / 4]
= √1.658
= 1.1.658**Skewness = 3(Mean - Median)/S.D.
By Applying Skewness Formula,
Skewness = 3(4.5 - 5)/1.658
= 3(-0.5)/ 1.658
Skewness = - 0.904So, the skewness of these data is negative.
**Example 2: A boy collects some rupees in a week as follows (25,28,26,30,40,50,40) and finds the skewness of the given Data in question with the help of the skewness formula.
**Solution:
Mean of Data = (25+28+26+30+40+50+40) / 7
= 239 / 7= 34.14
Number of terms (n) =7 (odd)
Arrange Data in ascending order = 25,26 ,28,30,40,40,50
The median of data is = 30Mode of Data = Highest Frequency term = 40 (frequency 2)
S.D = √(1/7 - 1) x ((25 - 34.1429)2 + (28 - 34.1429)2 + (26 - 34.1429)2 + (30 - 34.1429)2 + (40 - 34.1429)2 +(534.1429)2 + (40 - 34.1429)2)
= √(1/6) x ((-9.1429)2 + (-6.1429)2 + (-8.1429)2 + (-4.1429)2 + (5.8571)2 + (15.8571)2 + (5.8571)2)
= √(0.1667) x ((83.5926) + (37.7352) + (66.3068) + (17.1636) + (34.3056) + (251.4476) + (34.3056))
= √(0.1667) x 524.8571
= √87.4762
. = 9.3529Skewness = 3(Mean - Median)/S.D.
By Applying Skewness Formula,
Skewness = 3(34.14 - 30)/9.3529
= 1.32
Skewness = 1.32So skewness for these data is positive
**Example 3: The is of all classes of a school are as follows., find their skewness?
**1 st (35), 2 nd (32), 3 rd (38), 4 th (39), 5 th (43)
| Class Name | Number of students |
|---|---|
| 1st | 35 |
| 2nd | 32 |
| 3rd | 38 |
| 4th | 39 |
| 5th | 45 |
**Solution:
Mean of Data = (35 + 32 + 38 + 39 + 42)/5
= 186/5
= 37.2
Number of terms (n) = 5 (odd)
Arrange Data in ascending order = 32,35,38,39,42
Median of Data = 38
S.D. = √(1/5 - 1) x ((35 - 37.2)2 + (32 - 37.2)2 + (38 - 37.2)2 + (39 - 37.2)2 + (42 - 37.2)2)
= √(1/4) x ((-2.2)2 + (-5.2)2 + (0.8)2 + (1.8)2 + (4.8)2)
= √(0.25) x ((4.84) + (27.04) + (0.64) + (3.24) + (23.04))
= √(0.25) x 58.8
= √14.7
= 3.8341**Skewness = ∑(y i **- y mean ) / (n - 1) x (sd)³
Skewness =((35 - 37.2)³ + (32 - 37.2)³ + (38 - 37.2)³ + (39 - 37.2)³ + (42 - 37.2)³) / (5 - 1)³ x 3.8341
Skewness = ((-2.2)³ + (-5.2)³ + (0.8)³ + (1.8)³ + (4.8)³ )/ (4)³ x 3.8341
Skewness =((-10.648) + (-140.608) + (0.512) + (5.832) + (110.592)) / 64 x 3.8341
Skewness =-34.32 / 245.3824
Skewness = -0.1522So, the skewness of these data is negative.