Matplotlib.axes.Axes.legend() in Python (original) (raw)
Last Updated : 19 Apr, 2020
Matplotlib is a library in Python and it is numerical – mathematical extension for NumPy library. The Axes Class contains most of the figure elements: Axis, Tick, Line2D, Text, Polygon, etc., and sets the coordinate system. And the instances of Axes supports callbacks through a callbacks attribute.
matplotlib.axes.Axes.legend() Function
The Axes.legend() function in axes module of matplotlib library is used to place a legend on the axes.
Syntax: Axes.legend(self, *args, **kwargs)
Parameters: This method accepts the following parameters.
- labels : This parameter is the list of labels to show next to the artists.
- handles : This parameter is the list of Artists (lines, patches) to be added to the legend.
**Returns:**This method returns the matplotlib.legend.Legend instance.
Below examples illustrate the matplotlib.axes.Axes.legend() function in matplotlib.axes:
Example 1:
import matplotlib.pyplot as plt
fig, ax = plt.subplots()
line1, = ax.plot([ 1 , 2 , 3 ],
`` label = "Line 1" ,
`` color = "black" ,
`` linewidth = 4 ,
`` linestyle = ':' )
line2, = ax.plot([ 3 , 2 , 1 ],
`` label = "Line 2" ,
`` color = "green" ,
`` linewidth = 4 )
first_legend = ax.legend(handles = [line1],
`` loc = 'upper center' )
ax.add_artist(first_legend)
ax.legend(handles = [line2], loc = 'lower center' )
fig.suptitle('matplotlib.axes.Axes.legend() \
function Example\n', fontweight = "bold" )
plt.show()
Output: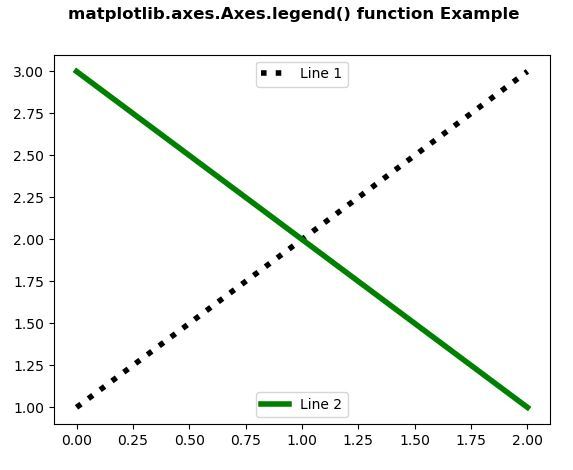
Example 2:
import numpy as np
import matplotlib.pyplot as plt
np.random.seed( 19680801 )
fig, ax = plt.subplots()
for color in [ 'tab:green' , 'tab:blue' ,
`` 'tab:orange' ]:
`` n = 70
`` x, y = np.random.rand( 2 , n)
`` scale = 1000.0 * np.random.rand(n)
`` ax.scatter(x, y, c = color, s = scale,
`` label = color,
`` alpha = 0.35 )
ax.legend()
ax.grid( True )
fig.suptitle('matplotlib.axes.Axes.legend() function\
`` Example\n', fontweight = "bold" )
plt.show()
Output: