Matplotlib.dates.DateFormatter class in Python (original) (raw)
Last Updated : 21 Apr, 2020
Matplotlib is an amazing visualization library in Python for 2D plots of arrays. Matplotlib is a multi-platform data visualization library built on NumPy arrays and designed to work with the broader SciPy stack.
Matplotlib.dates.DateFormatter
The matplotlib.dates.DateFormatter class is used to format a tick (in seconds since the epoch) with a string of strftime format. Its base class is matplotlib.ticker.Formatter.
Syntax: class matplotlib.dates.DateFormatter(fmt, tz=None)
Parameters:
- fmt: It accepts a strftime format string for formatting and is a required argument.
- tz: It holds information regarding the timezone. If set to none it ignores the timezone information while formatting of the date string.
Example 1:
import numpy
import matplotlib.pyplot as plt
import matplotlib.dates as mdates
import pandas
total_bars = 25
numpy.random.seed(total_bars)
dates = pandas.date_range( '3/4/2020' ,
`` periods = total_bars,
`` freq = 'm' )
diff = pandas.DataFrame(
`` data = numpy.random.randn(total_bars),
`` index = dates,
`` columns = [ 'A' ]
)
figure, axes = plt.subplots(figsize = ( 10 , 6 ))
axes.xaxis.set_major_formatter(mdates.DateFormatter( '%Y-%m' ))
axes.bar(diff.index,
`` diff[ 'A' ],
`` width = 25 ,
`` align = 'center' )
Output:
Example 2:
import matplotlib
import matplotlib.pyplot as plt
from datetime import datetime
origin = [ '2020-02-05 17:17:55' ,
`` '2020-02-05 17:17:51' ,
`` '2020-02-05 17:17:49' ]
a = [datetime.strptime(d, '%Y-%m-%d %H:%M:%S' ) for d in origin]
b = [ '35.764299' , '20.3008' , '36.94704' ]
x = matplotlib.dates.date2num(a)
formatter = matplotlib.dates.DateFormatter( '%H:%M:%S' )
figure = plt.figure()
axes = figure.add_subplot( 1 , 1 , 1 )
axes.xaxis.set_major_formatter(formatter)
plt.setp(axes.get_xticklabels(), rotation = 15 )
axes.plot(x, b)
plt.show()
Output: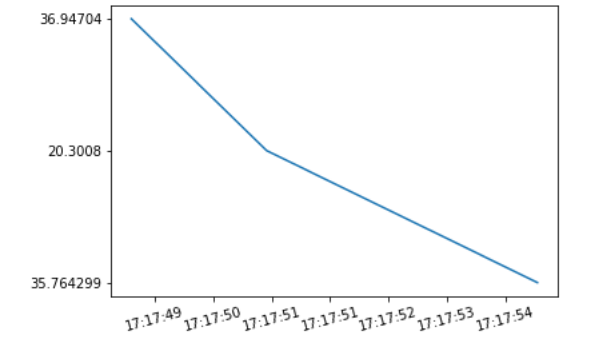
Similar Reads
- Matplotlib.dates.ConciseDateFormatter class in Python Matplotlib is an amazing visualization library in Python for 2D plots of arrays. Matplotlib is a multi-platform data visualization library built on NumPy arrays and designed to work with the broader SciPy stack. matplotlib.dates.ConciseDateFormatter The matplotlib.dates.ConciseDateFormatter class is 3 min read
- Matplotlib.dates.AutoDateFormatter class in Python Matplotlib is an amazing visualization library in Python for 2D plots of arrays. Matplotlib is a multi-platform data visualization library built on NumPy arrays and designed to work with the broader SciPy stack. matplotlib.dates.AutoDateFormatter The matplotlib.dates.AutoDateFormatter class is used 2 min read
- Matplotlib.ticker.FuncFormatter class in Python Matplotlib is an amazing visualization library in Python for 2D plots of arrays. Matplotlib is a multi-platform data visualization library built on NumPy arrays and designed to work with the broader SciPy stack. matplotlib.ticker.FuncFormatter The matplotlib.ticker.FuncFormatter class uses a user d 1 min read
- Matplotlib.dates.datestr2num() in Python Matplotlib is an amazing visualization library in Python for 2D plots of arrays. Matplotlib is a multi-platform data visualization library built on NumPy arrays and designed to work with the broader SciPy stack. matplotlib.dates.datestr2num() The matplotlib.dates.datestr2num() function is used to co 2 min read
- Matplotlib.ticker.IndexFormatter class in Python Matplotlib is an amazing visualization library in Python for 2D plots of arrays. Matplotlib is a multi-platform data visualization library built on NumPy arrays and designed to work with the broader SciPy stack. matplotlib.ticker.IndexFormatter The matplotlib.ticker.IndexFormatter class is a subclas 2 min read
- Matplotlib.dates.drange() in Python Matplotlib is an amazing visualization library in Python for 2D plots of arrays. Matplotlib is a multi-platform data visualization library built on NumPy arrays and designed to work with the broader SciPy stack. matplotlib.dates.drange() The matplotlib.dates.drange() function returns a sequence of e 2 min read
- Matplotlib.axes.Axes.plot_date() in Python Matplotlib is a library in Python and it is numerical - mathematical extension for NumPy library. The Axes Class contains most of the figure elements: Axis, Tick, Line2D, Text, Polygon, etc., and sets the coordinate system. And the instances of Axes supports callbacks through a callbacks attribute. 2 min read
- Matplotlib.ticker.LogFormatter Class in Python Matplotlib is an amazing visualization library in Python for 2D plots of arrays. Matplotlib is a multi-platform data visualization library built on NumPy arrays and designed to work with the broader SciPy stack. matplotlib.ticker.LogFormatter The matplotlib.ticker.LogFormatter class is used for form 2 min read
- Python DateTime - DateTime Class DateTime class of the DateTime module as the name suggests contains information on both dates as well as time. Like a date object, DateTime assumes the current Gregorian calendar extended in both directions; like a time object, DateTime assumes there are exactly 3600*24 seconds in every day. But unl 5 min read
- Matplotlib.axes.Axes.plot() in Python Axes.plot() method in Matplotlib is used to plot data on a set of axes. It is primarily used for creating line plots but can be extended for other types of plots, including scatter plots, bar plots, and more. When using this function, you typically provide the x and y coordinates of the data points 3 min read