Matplotlib.gridspec.GridSpec Class in Python (original) (raw)
Last Updated : 28 Apr, 2025
Matplotlib is an amazing visualization library in Python for 2D plots of arrays. Matplotlib is a multi-platform data visualization library built on NumPy arrays and designed to work with the broader SciPy stack.
matplotlib.gridspec.GridSpec
The matplotlib.gridspec.GridSpec class is used to specify the geometry of the grid to place a subplot. For this, to work the number of rows and columns must be set. Optionally, tuning of subplot layout parameters can be also done.
Syntax: class matplotlib.gridspec.GridSpec(nrows, ncols, figure=None, left=None, bottom=None, right=None, top=None, wspace=None, hspace=None, width_ratios=None, height_ratios=None)
Parameters:
- nrows: It is an integer representing the number of rows in the grid.
- ncols: It is an integer representing the number of columns in the grid.
- figure: It is an optional parameter used to draw figures.
- left, right, top, bottom: These are optional parameters used to define the extent of the subplots as fraction of figure width or height.
- wspase: It is an optional float argument used to reserve the width space between subplots.
- hspace: It is an optional float argument used to reserve the height space between subplots.
- width_ratios: It is an optional parameter that represents the width ratios of the columns.
- height_ratios: It is an optional parameter that represents the width ratios of the rows.
Methods of the class:
- get_subplot_params(self, figure=None): It returns a dictionary of subplot layout parameters. unless a figure attribute is set, the default parameter is from rcParams.
- ight_layout(self, figure, renderer=None, pad=1.08, h_pad=None, w_pad=None, rect=None): It is used to give specific padding to adjust the subplots. Here pad is a float value that sets padding between figure edge and the subplot edges as a fraction of the font size. The h_pad and w_pad are optional argument used to set padding between adjacent subplots. Also rect is used to normalize figure coordinates of a rectangle that includes all the subplot area. its default is (0, 0, 1, 1). It is a tuple of 4 floats.
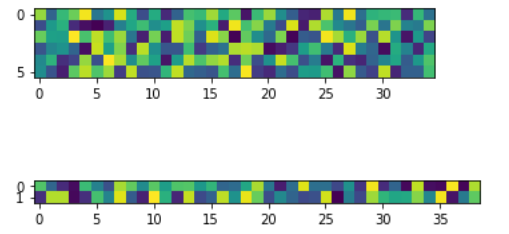
Example 1:
Python3 `
import numpy as np import matplotlib.pyplot as plt from matplotlib.gridspec import GridSpec
gs = GridSpec(8, 39) ax1 = plt.subplot(gs[:6, :35]) ax2 = plt.subplot(gs[6:, :])
data1 = np.random.rand(6, 35) data2 = np.random.rand(2, 39)
ax1.imshow(data1) ax2.imshow(data2)
plt.show()
`
Output:
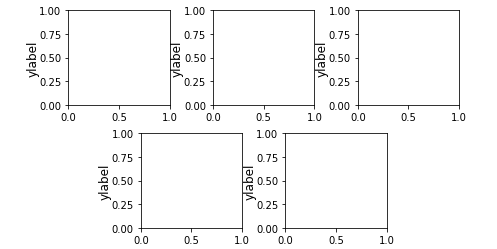
Example 2:
Python3 `
import matplotlib.pyplot as plt import matplotlib.gridspec as gridspec
fig = plt.figure(figsize =([7, 4]))
gs = gridspec.GridSpec(2, 6) gs.update(wspace = 1.5, hspace = 0.3)
ax1 = plt.subplot(gs[0, :2]) ax1.set_ylabel('ylabel', labelpad = 0, fontsize = 12)
ax2 = plt.subplot(gs[0, 2:4]) ax2.set_ylabel('ylabel', labelpad = 0, fontsize = 12)
ax3 = plt.subplot(gs[0, 4:6]) ax3.set_ylabel('ylabel', labelpad = 0, fontsize = 12)
ax4 = plt.subplot(gs[1, 1:3]) ax4.set_ylabel('ylabel', labelpad = 0, fontsize = 12)
ax5 = plt.subplot(gs[1, 3:5]) ax5.set_ylabel('ylabel', labelpad = 0, fontsize = 12)
plt.show()
`
Output: