matplotlib.pyplot.arrow() in Python (original) (raw)
Last Updated : 07 Apr, 2025
**Matplotlib is a very powerful plotting library Python, widely used for data visualization and statistical analysis. One of its useful functions is **arrow(), which lets you add arrows to your plots to highlight or point out specific data points or trends.
This article explains how to use the **arrow() function, its syntax and how to customize arrows using various parameters.
Example 1: Basic Arrow Addition
This example shows how to add a simple arrow to a plot.
Python `
import matplotlib.pyplot as plt
Data points
x = [1, 2, 3, 4, 5] y = [2, 4, 6, 8, 10]
Plot the data
plt.plot(x, y)
Add an arrow starting at (2, 4) with dx = 2 and dy = 2, and a specified width
plt.arrow(2, 4, 2, 2, width=0.05)
Display the plot
plt.show()
`
**Output:

**Explanation:
- The arrow starts at coordinates (2, 4).
- The arrow extends **2 units in both the **x and **y directions.
- The **width of the arrow shaft is set to **0.05.
Syntax
matplotlib.pyplot.arrow(x, y, dx, dy, **kwargs)
**Parameters:
- x, y: The x and y coordinates of the arrow base.
- dx, dy: The length of the arrow along x and y direction.
- **kwargs: Optional arguments that helps in adding properties to arrow, like adding color to arrow, changing width of arrow.
Examples of arrow() function
Example 1 : Adjusting Arrow Head Width
This example demonstrates how to increase the arrowhead width for better visibility.
Python `
import matplotlib.pyplot as plt
x = [1, 2, 3, 4, 5] y = [2, 4, 6, 8, 10] plt.plot(x, y)
Add an arrow with a larger head width (0.2) and a shaft width of 0.05
plt.arrow(2, 4, 2, 2, head_width=0.2, width=0.05)
plt.show()
`
**Output:
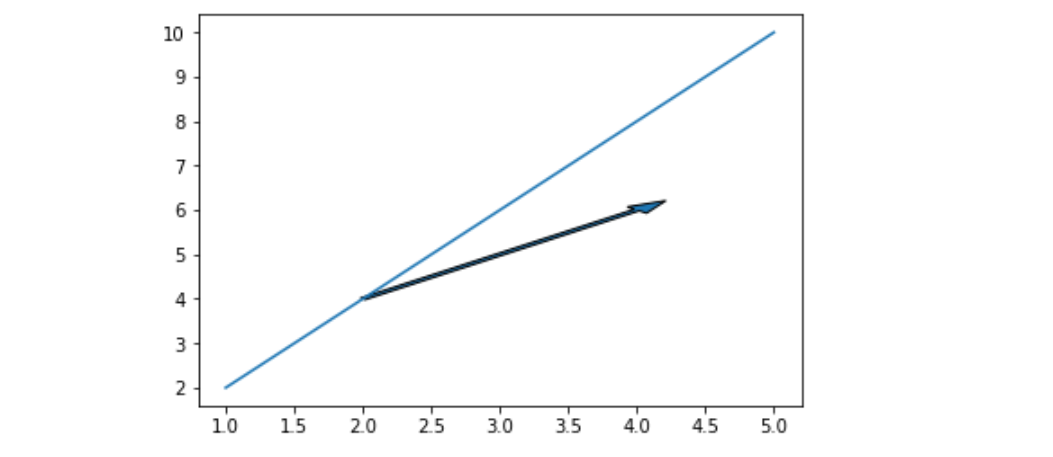
**Explanation:
- The arrowhead **width is increased toB.
- The arrow's **base, **displacement, and **shaft width remain the **same as in Example 1.
Example 2: Changing Arrow Edge Color
This example shows how to change the arrow's edge color to green.
Python `
import matplotlib.pyplot as plt
x = [1, 2, 3, 4, 5] y = [2, 4, 6, 8, 10] plt.plot(x, y)
Add an arrow with a green edge color
plt.arrow(2, 4, 2, 2, head_width=0.2, width=0.05, ec='green')
plt.show()
`
**Output:
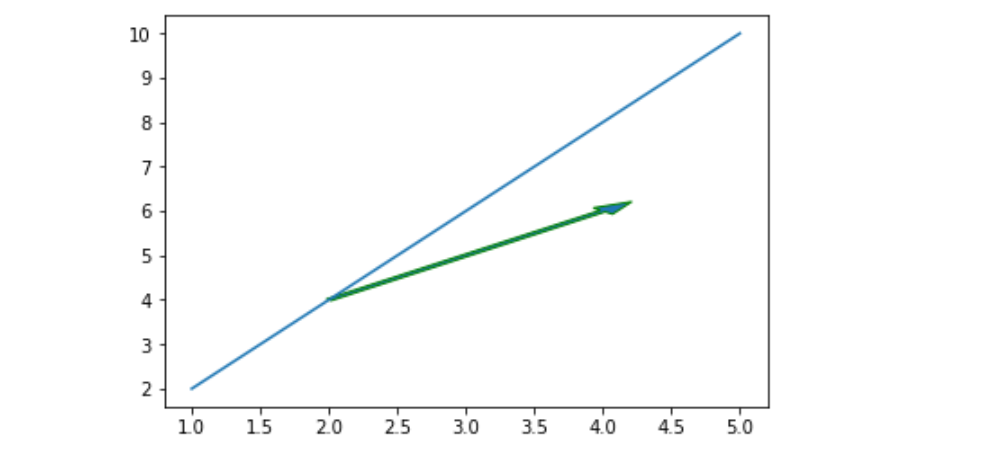
**Explanation:
- The arrow's edge color (**ec) is set to green.
- Other properties such as head width and shaft width are maintained.