Matplotlib.pyplot.connect() in Python (original) (raw)
Last Updated : 03 May, 2020
Matplotlib is a library in Python and it is numerical - mathematical extension for NumPy library. Pyplot is a state-based interface to a Matplotlib module which provides a MATLAB-like interface.
matplotlib.pyplot.connect() Function
This method is used to connect an event with string s to a function.
Syntax: matplotlib.pyplot.connect(s, func)Parameters: This method accept the following parameters that are described below:s(str): One of the following events ids: 1. 'button_press_event' 2. 'button_release_event' 3. 'draw_event' 4. 'key_press_event' 5. 'key_release_event' 6. 'motion_notify_event' 7. 'pick_event' 8. 'resize_event' 9. 'scroll_event' 10. 'figure_enter_event', 11. 'figure_leave_event', 12. 'axes_enter_event', 13. 'axes_leave_event' 14. 'close_event'.func(callable): The callback function to be executed, which must have the signature: def func(event: Event) -> AnyReturns(cid): A connection id that can be used with FigureCanvasBase.mpl_disconnect.
Example 1 :
Python3 1== `
matplotlib.pyplot.connect()
from matplotlib.backend_bases import MouseButton import matplotlib.pyplot as plt import numpy as np
t = np.arange(0.0, 1.0, 0.01) s = np.sin(2 * np.pi * t) fig, ax = plt.subplots() ax.plot(t, s)
def on_move(event):
# get the x and y pixel coords
x, y = event.x, event.y
if event.inaxes:
ax = event.inaxes # the axes instance
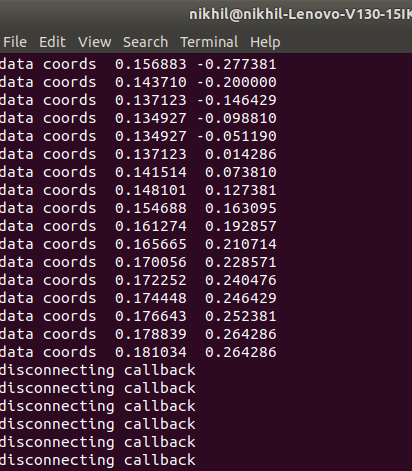
print('data coords % f % f' % (event.xdata,
event.ydata))def on_click(event):
if event.button is MouseButton.LEFT:
    print('disconnecting callback')
    plt.disconnect(binding_id)
binding_id = plt.connect('motion_notify_event', on_move)
plt.connect('button_press_event', on_click)
plt.show()
`
Output : 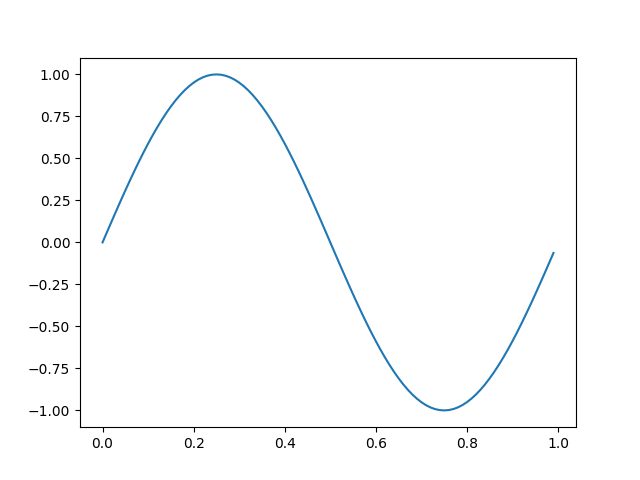
 Example 2 :
Python3 1== `
from matplotlib.widgets import RectangleSelector import numpy as np import matplotlib.pyplot as plt
def line_select_callback(eclick, erelease):
# Callback for line selection.
# *eclick * and * erelease *
# are the press and release events.
x1, y1 = eclick.xdata, eclick.ydata
x2, y2 = erelease.xdata, erelease.ydata
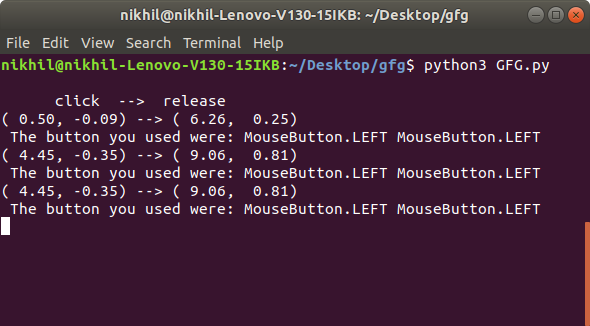
print("(% 3.2f, % 3.2f) --> (% 3.2f, % 3.2f)" % (x1, y1, x2, y2))
print(" The button you used were: % s % s" % (eclick.button,
erelease.button))def toggle_selector(event):
print(' Key pressed.')

if event.key in ['Q', 'q'] and toggle_selector.RS.active:
    print(' RectangleSelector deactivated.')
    toggle_selector.RS.set_active(False)
    print(' RectangleSelector activated.')
    toggle_selector.RS.set_active(True)
make a new plotting range
fig, current_ax = plt.subplots()
If N is large one can see
N = 100000
improvement by use blitting !
plt.plot(x, +np.sin(.2 * np.pi * x),
lw = 3.5, c ='b', alpha =.7)
plot something
x = np.linspace(0.0, 10.0, N) plt.plot(x, +np.cos(.2 * np.pi * x), lw = 3.5, c ='c', alpha =.5) plt.plot(x, -np.sin(.2 * np.pi * x), lw = 3.5, c ='r', alpha =.3)
print("\n click --> release")
drawtype is 'box' or 'line' or 'none'
toggle_selector.RS = RectangleSelector(current_ax, line_select_callback, drawtype ='box', useblit = True, button =[1, 3], # don't use middle button minspanx = 5, minspany = 5, spancoords ='pixels', interactive = True)
plt.connect('key_press_event', toggle_selector) plt.show()
`
Output : 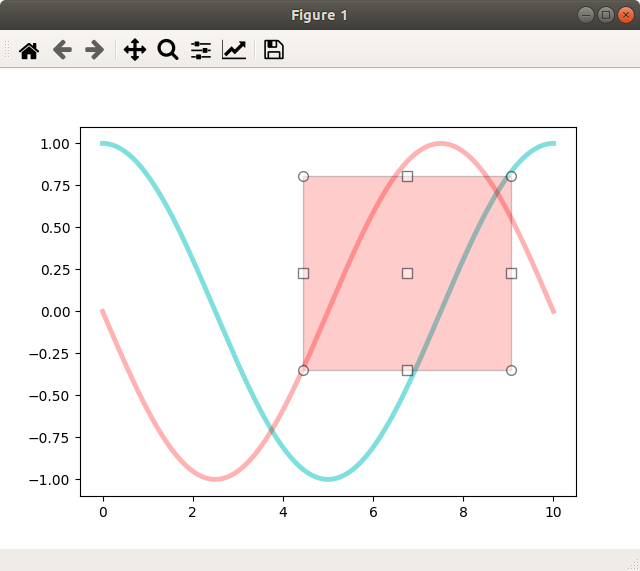
Similar Reads
- Python Tutorial | Learn Python Programming Language Python Tutorial – Python is one of the most popular programming languages. It’s simple to use, packed with features and supported by a wide range of libraries and frameworks. Its clean syntax makes it beginner-friendly.Python is:A high-level language, used in web development, data science, automatio 10 min read
- Python Interview Questions and Answers Python is the most used language in top companies such as Intel, IBM, NASA, Pixar, Netflix, Facebook, JP Morgan Chase, Spotify and many more because of its simplicity and powerful libraries. To crack their Online Assessment and Interview Rounds as a Python developer, we need to master important Pyth 15+ min read
- Python OOPs Concepts Object Oriented Programming is a fundamental concept in Python, empowering developers to build modular, maintainable, and scalable applications. By understanding the core OOP principles (classes, objects, inheritance, encapsulation, polymorphism, and abstraction), programmers can leverage the full p 11 min read
- Python Projects - Beginner to Advanced Python is one of the most popular programming languages due to its simplicity, versatility, and supportive community. Whether you’re a beginner eager to learn the basics or an experienced programmer looking to challenge your skills, there are countless Python projects to help you grow.Here’s a list 10 min read
- Python Exercise with Practice Questions and Solutions Python Exercise for Beginner: Practice makes perfect in everything, and this is especially true when learning Python. If you're a beginner, regularly practicing Python exercises will build your confidence and sharpen your skills. To help you improve, try these Python exercises with solutions to test 9 min read
- Python Programs Practice with Python program examples is always a good choice to scale up your logical understanding and programming skills and this article will provide you with the best sets of Python code examples.The below Python section contains a wide collection of Python programming examples. These Python co 11 min read
- Python Data Types Python Data types are the classification or categorization of data items. It represents the kind of value that tells what operations can be performed on a particular data. Since everything is an object in Python programming, Python data types are classes and variables are instances (objects) of thes 9 min read
- Enumerate() in Python enumerate() function adds a counter to each item in a list or other iterable. It turns the iterable into something we can loop through, where each item comes with its number (starting from 0 by default). We can also turn it into a list of (number, item) pairs using list().Let's look at a simple exam 3 min read
- Python Lists In Python, a list is a built-in dynamic sized array (automatically grows and shrinks). We can store all types of items (including another list) in a list. A list may contain mixed type of items, this is possible because a list mainly stores references at contiguous locations and actual items maybe s 6 min read
- Python Introduction Python was created by Guido van Rossum in 1991 and further developed by the Python Software Foundation. It was designed with focus on code readability and its syntax allows us to express concepts in fewer lines of code.Key Features of PythonPython’s simple and readable syntax makes it beginner-frien 3 min read