Matplotlib.pyplot.draw() in Python (original) (raw)
Last Updated : 21 Apr, 2020
Matplotlib is a library in Python and it is numerical – mathematical extension for NumPy library. Pyplot is a state-based interface to a Matplotlib module which provides a MATLAB-like interface.
matplotlib.pyplot.draw() Function
The draw() function in pyplot module of matplotlib library is used to redraw the current figure.
Syntax: matplotlib.pyplot.draw()
Below examples illustrate the matplotlib.pyplot.draw() function in matplotlib.pyplot:
Example #1:
import numpy as np
import matplotlib.pyplot as plt
def tellme(s):
`` plt.title(s, fontsize = 16 )
`` plt.draw()
plt.clf()
plt.setp(plt.gca(), autoscale_on = False )
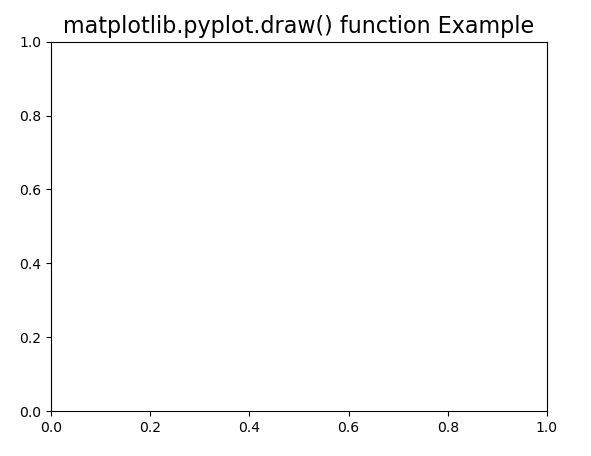
tellme( 'matplotlib.pyplot.draw() function Example' )
plt.show()
Output:
Example #2:
from mpl_toolkits.mplot3d import axes3d
import matplotlib.pyplot as plt
fig = plt.figure()
ax = fig.add_subplot( 111 , projection = '3d' )
X, Y, Z = axes3d.get_test_data( 0.1 )
ax.plot_wireframe(X, Y, Z, rstride = 5 ,
`` cstride = 5 )
for angle in range ( 0 , 360 ):
`` ax.view_init( 30 , angle)
`` plt.draw()
`` plt.pause(. 001 )
`` ax.set_title('matplotlib.pyplot.draw()\
`` function Example', fontweight = "bold" )
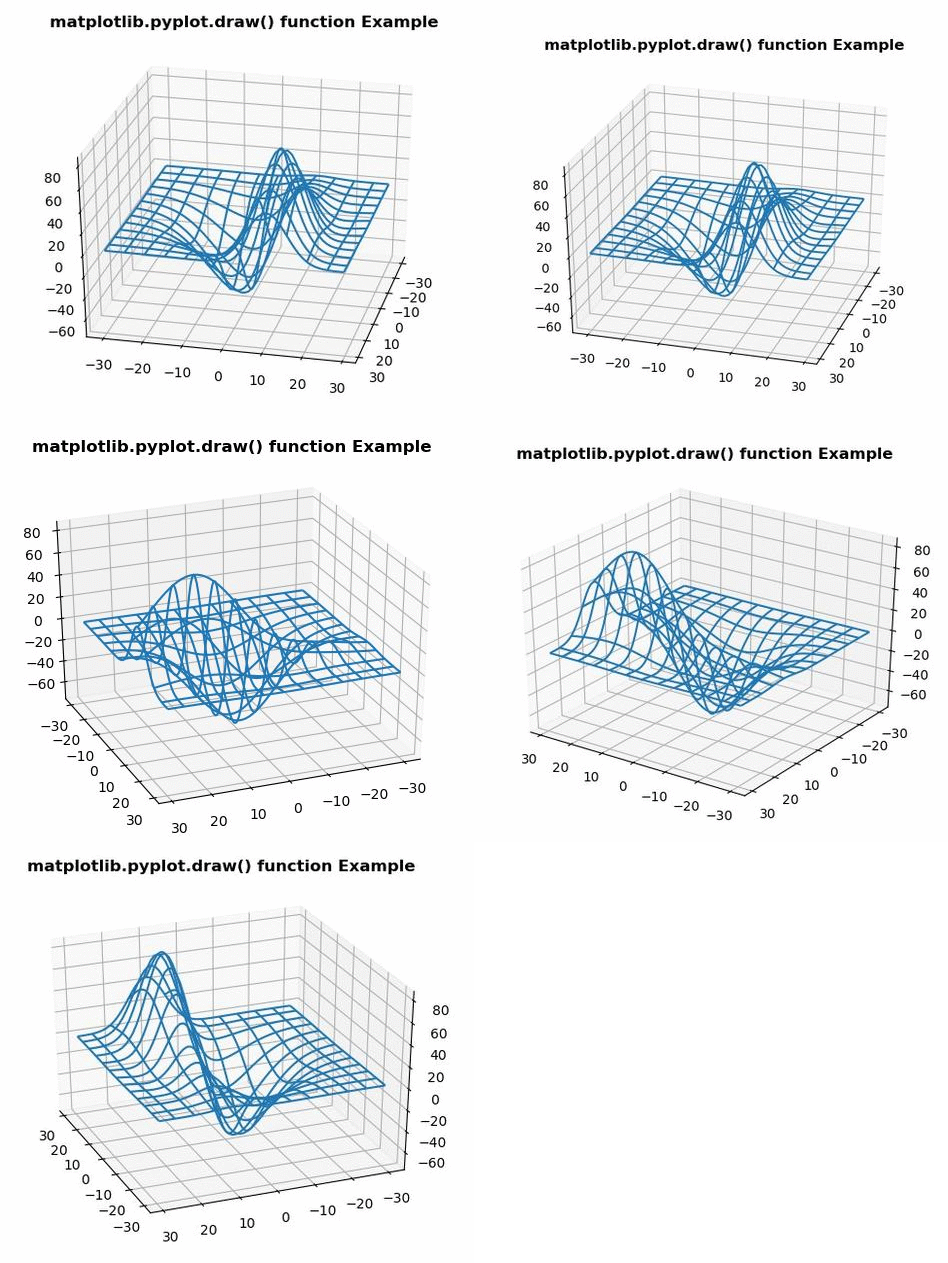
Output:
Similar Reads
- Matplotlib.pyplot.gray() in Python Matplotlib is a library in Python and it is numerical - mathematical extension for NumPy library. Pyplot is a state-based interface to a Matplotlib module which provides a MATLAB-like interface. Matplotlib.pyplot.gray() Function The gray() function in pyplot module of matplotlib library is used to s 2 min read
- Matplotlib.pyplot.gca() in Python Matplotlib is a library in Python and it is a numerical - mathematical extension for the NumPy library. Pyplot is a state-based interface to a Matplotlib module that provides a MATLAB-like interface.  matplotlib.pyplot.gca() Function The gca() function in pyplot module of matplotlib library is used 2 min read
- Matplotlib.pyplot.cla() in Python Matplotlib is a library in Python and it is numerical - mathematical extension for NumPy library. Pyplot is a state-based interface to a Matplotlib module which provides a MATLAB-like interface. There are various plots which can be used in Pyplot are Line Plot, Contour, Histogram, Scatter, 3D Plot, 1 min read
- Matplotlib.pyplot.csd() in Python Matplotlib is a library in Python and it is numerical - mathematical extension for NumPy library. Pyplot is a state-based interface to a Matplotlib module which provides a MATLAB-like interface. matplotlib.pyplot.csd() Function The csd() function in pyplot module of matplotlib library is used to plo 3 min read
- matplotlib.pyplot.arrow() in Python Matplotlib is a very powerful plotting library Python, widely used for data visualization and statistical analysis. One of its useful functions is arrow(), which lets you add arrows to your plots to highlight or point out specific data points or trends. This article explains how to use the arrow() f 2 min read
- Matplotlib.pyplot.axes() in Python Pyplot is another module of matplotlib that enables users to integrate MATLAB within Python environment, and thus providing MATLAB like interface and making Python visually interactive. Matplotlib.pyplot.axes() pyplot.axes is a function of the matplotlib library that adds axes to the current graph a 2 min read
- Matplotlib.pyplot.grid() in Python Matplotlib is a library in Python and it is numerical - mathematical extension for NumPy library. Pyplot is a state-based interface to a Matplotlib module which provides a MATLAB-like interface. matplotlib.pyplot.grid() Function The grid() function in pyplot module of matplotlib library is used to c 2 min read
- Matplotlib.pyplot.axis() in Python Matplotlib is a plotting library for creating static, animated, and interactive visualizations in Python. Pyplot is a Matplotlib module which provides a MATLAB-like interface. Matplotlib is designed to be as usable as MATLAB, with the ability to use Python and the advantage of being free and open-so 1 min read
- Matplotlib.pyplot.flag() in Python Matplotlib is a library in Python and it is numerical - mathematical extension for NumPy library. Pyplot is a state-based interface to a Matplotlib module which provides a MATLAB-like interface. matplotlib.pyplot.flag() Function The flag() function in pyplot module of matplotlib library is used to s 2 min read
- Matplotlib.pyplot.delaxes() in Python Matplotlib is a library in Python and it is numerical - mathematical extension for NumPy library. Pyplot is a state-based interface to a Matplotlib module which provides a MATLAB-like interface. matplotlib.pyplot.delaxes() Function The delaxes() function in pyplot module of matplotlib library is use 2 min read