Matplotlib.pyplot.figimage() function in Python (original) (raw)
Last Updated : 10 Jul, 2020
Matplotlib is a widely used library in Python for plotting various graphs, as it provides very efficient ways and easy to understand methods for complex plots also. pyplot is a collection of command style functions that make matplotlib work like MATLAB.
figimage() function
matplotlib.pyplot.figimage() is a method for adding a non-resampled image to the figure. Usually, it attaches the image to the lower or upper left corner depending on origin.
Syntax: matplotlib.pyplot.figimage(*args, **kwargs)Parameters: alpha is a float valued parameter, It is used to give the blending value for the image. It is an optional parameter. When not specified, it takes the default value as 'None'. Xo, Yo is another important parameter which states the shape of the image data. Usually it can be 'both', 'x', or 'y'. It takes the x/y image offset in pixels.**kwargs It is an additional parameter generally known as kwargs. They are Artist kwargs passed on to FigureImage.
Now let us take a simple examples to illustrate the working of matplotlib.pyplot.figimage().Example 1:
Python3 `
import numpy as np import matplotlib import matplotlib.pyplot as plt
fig = plt.figure() Z = np.arange(10000).reshape((100, 100)) Z[:, 50:] = 1
im1 = fig.figimage(Z, xo = 50, yo = 0, origin ='lower') im2 = fig.figimage(Z, xo = 100, yo = 100, alpha =.8, origin ='lower')
plt.show()
`
Output: Example 2:
Python3 1== `
import numpy as np import matplotlib.pyplot as plt
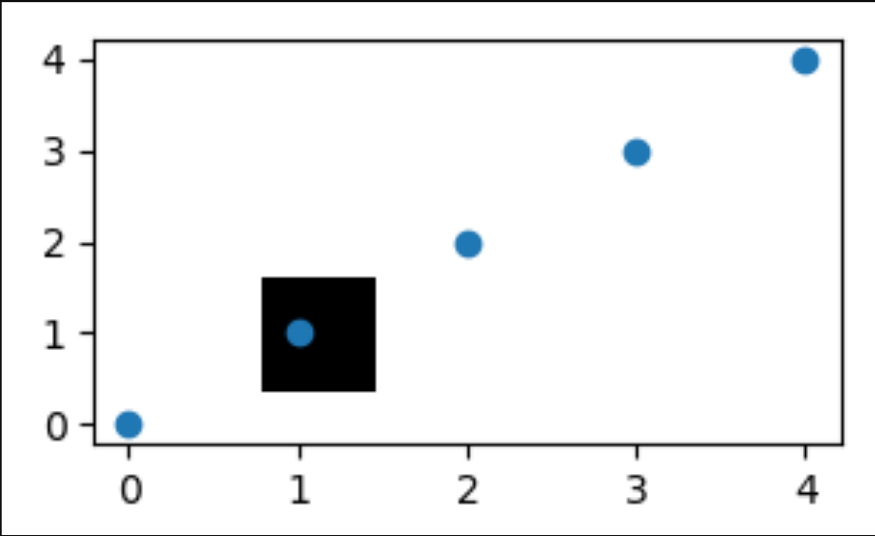
im = np.zeros((40, 40, 3), dtype = np.float)
fig, ax = plt.subplots() im = fig.figimage(im, 100, 60)
ax.scatter([0, 1, 2, 3, 4], [0, 1, 2, 3, 4])
ax.set_zorder(1) im.set_zorder(0) ax.patch.set_visible(False)
plt.show()
`
Output:
Similar Reads
- Matplotlib.pyplot.figlegend() function in Python Matplotlib is a Python library used for creating, animations, and editing graphs, plots, and figures using Pyplot. Matplotlib.pyplot has many functions defined in it to use, as per the preference and requirement of the user demands. matplotlib.pyplot.figlegend() function  This is used to place a leg 3 min read
- Matplotlib.pyplot.plot_date() function in Python Matplotlib is a module package or library in Python which is used for data visualization. Pyplot is an interface to a Matplotlib module that provides a MATLAB-like interface. The matplotlib.pyplot.plot_date() function is like the regular plot() function, but it's tailored for showing data over dates 3 min read
- Matplotlib.pyplot.setp() function in Python Matplotlib is a library in Python and it is numerical – mathematical extension for NumPy library. Pyplot is a state-based interface to a Matplotlib module which provides a MATLAB-like interface. There are various plots which can be used in Pyplot are Line Plot, Contour, Histogram, Scatter, 3D Plot, 2 min read
- Matplotlib.pyplot.plot() function in Python The matplotlib.pyplot.plot() is used to create 2D plots such as line graphs and scatter plots. The plot() function allows us to plot data points, customize line styles, markers and colors making it useful for various types of visualizations. In this article, we'll see how to use this function to plo 3 min read
- Matplotlib.pyplot.get_fignums() in Python Matplotlib is a library in Python and it is numerical – mathematical extension for NumPy library. Pyplot is a state-based interface to a Matplotlib module which provides a MATLAB-like interface. There are various plots which can be used in Pyplot are Line Plot, Contour, Histogram, Scatter, 3D Plot, 2 min read
- Matplotlib.pyplot.gci() in Python Matplotlib is a library in Python and it is numerical – mathematical extension for NumPy library. Pyplot is a state-based interface to a Matplotlib module which provides a MATLAB-like interface. There are various plots which can be used in Pyplot are Line Plot, Contour, Histogram, Scatter, 3D Plot, 2 min read
- Matplotlib.pyplot.figtext() in Python Matplotlib is an extensively used Python library for data visualization. It is a multi-platform data visualization library built on NumPy arrays, also designed to work with the SciPy stack. Matplotlib.pyplot.figtext() Figtext is used to add text to a figure at any location on it. You can even add th 3 min read
- Matplotlib.pyplot.pcolor() function in Python Matplotlib is the well-known Python package used in data visualization. Numpy is the numerical mathematics extension of Matplotlib. Matplotlib is capable of producing high-quality graphs, charts, and figures. Matplotlib produces object-oriented API for embedding plots into projects using GUI toolkit 2 min read
- Matplotlib.pyplot.xscale() function in Python Matplotlib is a library in Python and it is numerical – mathematical extension for NumPy library. Pyplot is a state-based interface to a Matplotlib module which provides a MATLAB-like interface. There are various plots which can be used in Pyplot are Line Plot, Contour, Histogram, Scatter, 3D Plot, 2 min read
- matplotlib.pyplot.figure() in Python Matplotlib is a library in Python and it is numerical - mathematical extension for NumPy library. Pyplot is a state-based interface to a Matplotlib module which provides a MATLAB-like interface. There are various plots which can be used in Pyplot are Line Plot, Contour, Histogram, Scatter, 3D Plot, 2 min read