Matplotlib.pyplot.fill() function in Python (original) (raw)
Last Updated : 25 Nov, 2020
Matplotlib.pyplot.fill() function is used to fill the area enclosed by polygon /curve.
Syntax: matplotlib.pyplot.fill(*args, data=None, **kwargs)
Parameters: *args: sequence of x, y, [color] sequence of x,y = To traverse the boundaries of the polygon or curve defined by lists of x and y positions of its nodes.color = To change the default fill color to the desired one.You can plot multiple polygons by providing multiple x, y, [color] groups.data: indexable object, optional default value = none You can directly provide labeled data in the form of a dictionary. For better understanding refer to Example2
Returns: A list of Polygon
Other Parameters: **kwargs: Supports all other properties of Polygon patch.
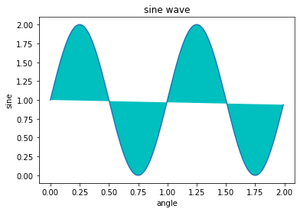
Example 1:
Python3 `
Importing the library
import matplotlib import matplotlib.pyplot as plt import numpy as np
Data for plotting
x = np.arange(0.0, 2.0, 0.01) y = 1 + np.sin(2 * np.pi * x) plt.plot(x, y)
Assighning plot attributes
plt.xlabel("angle") plt.ylabel("sine") plt.title('sine wave')
Filling sign wave curv with cyan color
plt.fill(x, y, "c") plt.show()
`
Output:
Example 1_Output_GFG
Example 2:
Python3 `
Importing libraries
import matplotlib import matplotlib.pyplot as plt
Below we are using data attribute
plt.fill("j", "k", 'm', data={"j": [0, 1, 2], "k": [0, 1, 0]}) # here 'm' for magenta
`
Output:

Example 2_Output_GFG
Similar Reads
- Matplotlib.pyplot.figimage() function in Python Matplotlib is a widely used library in Python for plotting various graphs, as it provides very efficient ways and easy to understand methods for complex plots also. pyplot is a collection of command style functions that make matplotlib work like MATLAB. figimage() function matplotlib.pyplot.figimage 2 min read
- Matplotlib.pyplot.setp() function in Python Matplotlib is a library in Python and it is numerical – mathematical extension for NumPy library. Pyplot is a state-based interface to a Matplotlib module which provides a MATLAB-like interface. There are various plots which can be used in Pyplot are Line Plot, Contour, Histogram, Scatter, 3D Plot, 2 min read
- Matplotlib.pyplot.plot() function in Python The matplotlib.pyplot.plot() is used to create 2D plots such as line graphs and scatter plots. The plot() function allows us to plot data points, customize line styles, markers and colors making it useful for various types of visualizations. In this article, we'll see how to use this function to plo 3 min read
- matplotlib.pyplot.step() function in Python The step() function designs the plot such that, it has a horizontal baseline to which the data points will be connected by vertical lines. This kind of plot is used to analyze at which points the change in Y-axis value has occurred exactly with respect to X-axis. This is very useful in discrete anal 5 min read
- Matplotlib.pyplot.pcolor() function in Python Matplotlib is the well-known Python package used in data visualization. Numpy is the numerical mathematics extension of Matplotlib. Matplotlib is capable of producing high-quality graphs, charts, and figures. Matplotlib produces object-oriented API for embedding plots into projects using GUI toolkit 2 min read
- Matplotlib.pyplot.hexbin() function in Python Matplotlib is a library in Python and it is numerical – mathematical extension for NumPy library. Pyplot is a state-based interface to a Matplotlib module which provides a MATLAB-like interface. There are various plots which can be used in Pyplot are Line Plot, Contour, Histogram, Scatter, 3D Plot, 2 min read
- Matplotlib.pyplot.xscale() function in Python Matplotlib is a library in Python and it is numerical – mathematical extension for NumPy library. Pyplot is a state-based interface to a Matplotlib module which provides a MATLAB-like interface. There are various plots which can be used in Pyplot are Line Plot, Contour, Histogram, Scatter, 3D Plot, 2 min read
- Matplotlib.pyplot.suptitle() function in Python Matplotlib is a library in Python and it is a mathematical extension for NumPy library. Pyplot is a state-based interface to a Matplotlib module which provides a MATLAB-like interface. matplotlib.pyplot.suptitle() Function The suptitle() function in pyplot module of the matplotlib library is used to 3 min read
- Matplotlib.pyplot.findobj() in Python Matplotlib is an amazing visualization library in Python for 2D plots of arrays. Matplotlib is a multi-platform data visualization library built on NumPy arrays and designed to work with the broader SciPy stack. matplotlib.pyplot.findobj() This function is used to recursively find all instances of a 2 min read
- matplotlib.pyplot.figure() in Python Matplotlib is a library in Python and it is numerical - mathematical extension for NumPy library. Pyplot is a state-based interface to a Matplotlib module which provides a MATLAB-like interface. There are various plots which can be used in Pyplot are Line Plot, Contour, Histogram, Scatter, 3D Plot, 2 min read