Matplotlib.pyplot.flag() in Python (original) (raw)
Last Updated : 21 Apr, 2020
Matplotlib is a library in Python and it is numerical - mathematical extension for NumPy library. Pyplot is a state-based interface to a Matplotlib module which provides a MATLAB-like interface.
matplotlib.pyplot.flag() Function
The flag() function in pyplot module of matplotlib library is used to set the colormap to "flag".
Syntax: matplotlib.pyplot.flag()
Below examples illustrate the matplotlib.pyplot.flag() function in matplotlib.pyplot:Example #1:
Python3 1== `
Implementation of matplotlib function
import matplotlib.pyplot as plt import matplotlib.tri as tri import numpy as np
ang = 40 rad = 10 radm = 0.35 radii = np.linspace(radm, 0.95, rad)
angles = np.linspace(0, 0.5 * np.pi, ang) angles = np.repeat(angles[..., np.newaxis], rad, axis = 1)
angles[:, 1::2] += np.pi / ang
x = (radii * np.cos(angles)).flatten() y = (radii * np.sin(angles)).flatten() z = (np.sin(4 * radii) * np.cos(4 * angles)).flatten()
triang = tri.Triangulation(x, y) triang.set_mask(np.hypot(x[triang.triangles].mean(axis = 1), y[triang.triangles].mean(axis = 1)) < radm)
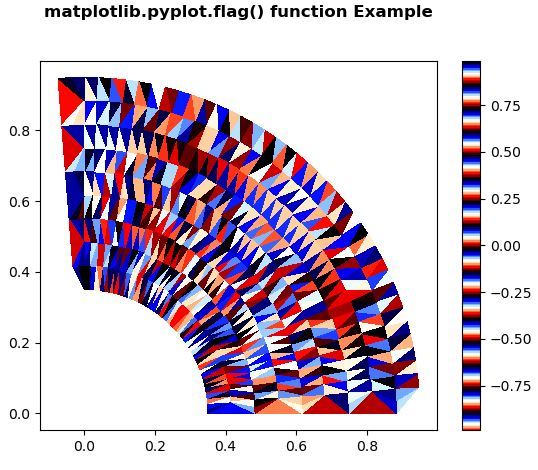
tpc = plt.tripcolor(triang, z, shading ='flat') plt.colorbar(tpc) plt.flag() plt.title('matplotlib.pyplot.flag() function Example\n\n', fontweight ="bold")
plt.show()
`
Output:  Example #2:
Python3 1== `
Implementation of matplotlib function
import matplotlib.pyplot as plt import numpy as np from matplotlib.colors import LogNorm
dx, dy = 0.015, 0.05 x = np.arange(-4.0, 4.0, dx) y = np.arange(-4.0, 4.0, dy) X, Y = np.meshgrid(x, y)
extent = np.min(x), np.max(x), np.min(y), np.max(y)
Z1 = np.add.outer(range(8), range(8)) % 2 plt.imshow(Z1, cmap ="binary_r", interpolation ='nearest', extent = extent, alpha = 1)
def geeks(x, y): return (1 - x / 2 + x5 + y6) * np.exp(-(x2 + y2))
Z2 = geeks(X, Y)
plt.imshow(Z2, alpha = 0.7, interpolation ='bilinear', extent = extent)
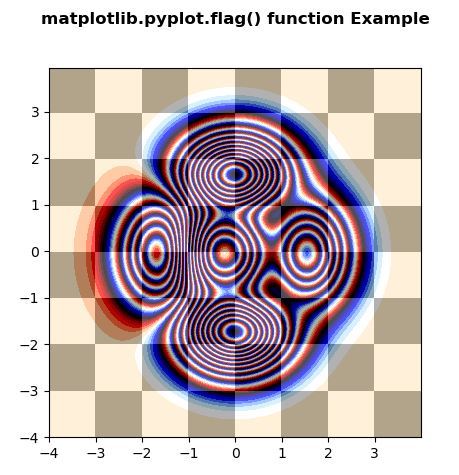
plt.set_cmap("gist_rainbow") plt.flag() plt.title('matplotlib.pyplot.flag() function Example\n\n', fontweight ="bold") plt.show()
`
Output: 