Matplotlib.pyplot.ginput() in Python (original) (raw)
Last Updated : 30 Apr, 2020
Matplotlib is a library in Python and it is numerical – mathematical extension for NumPy library. Pyplot is a state-based interface to a Matplotlib module which provides a MATLAB-like interface. There are various plots which can be used in Pyplot are Line Plot, Contour, Histogram, Scatter, 3D Plot, etc.
matplotlib.pyplot.table() Function
The ginput() method pyplot module of matplotlib library is used to block call to interact with a figure.
Syntax: matplotlib.pyplot.ginput(n=1, timeout=30, show_clicks=True, mouse_add=1, mouse_pop=3, mouse_stop=2)Parameters: This method accept the following parameters that are described below:
- n : This parameter is the number of mouse clicks to accumulate.
- timeout : This parameter is the number of seconds to wait before timing out.
- show_clicks : This parameter is used to show a red cross at the location of each click.
- mouse_add : This parameter is the Mouse button used to add points.
- mouse_pop : This parameter is the Mouse button used to remove the most recently added point.
- mouse_stop : This parameter is the Mouse button used to stop input. Returns: This method return the list of the clicked (x, y) coordinates.
Below examples illustrate the matplotlib.pyplot.ginput() function in matplotlib.pyplot:Example 1:
Python3 `
Implementation of matplotlib function
import matplotlib.pyplot as plt import numpy as np t = np.arange(10)
plt.plot(t, np.sin(t))
plt.title('matplotlib.pyplot.ginput()
function Example', fontweight ="bold")
print("After 3 clicks :") x = plt.ginput(3) print(x)
plt.show()
`
Output: 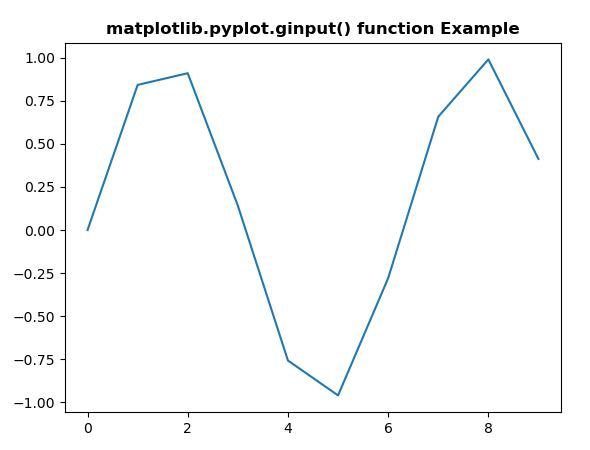
After 3 clicks : [(4.460080645161289, 0.5915838985273842), (4.460080645161289, 0.5915838985273842), (4.460080645161289, 0.5915838985273842)]
Example 2:
Python3 `
Implementation of matplotlib function
import matplotlib.pyplot as plt import numpy as np
np.random.seed(10**7)
x1 = np.random.rand(103, 53)
plt.title('matplotlib.pyplot.ginput() function
Example', fontweight ="bold")
print("After 2 clicks :") plt.imshow(x1) x = plt.ginput(2) print(x)
plt.show()
`
Output: 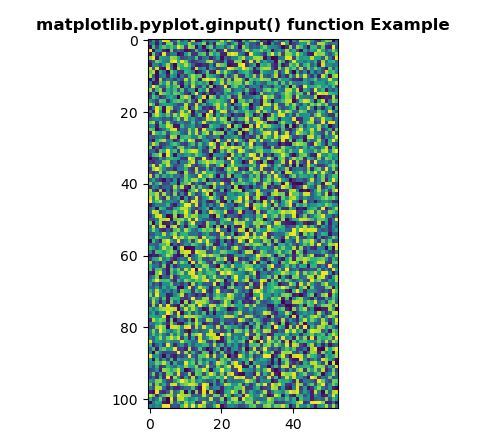
After 2 clicks : [(8.443181818181813, 38.90530303030302), (8.443181818181813, 38.90530303030302)]