Matplotlib.pyplot.hlines() in Python (original) (raw)
Last Updated : 19 Apr, 2020
Matplotlib is an amazing visualization library in Python for 2D plots of arrays. Matplotlib is a multi-platform data visualization library built on NumPy arrays and designed to work with the broader SciPy stack.
Matplotlib.pyplot.hlines()
The Matplotlib.pyplot.hlines() is used to draw horizontal lines in a graph at each y from xmin to xmax.
Syntax: matplotlib.pyplot.hlines(y, xmin, xmax, colors='k', linestyles='solid', label='', *, data=None, **kwargs**Parameters:**The
Matplotlib.pyplot.hlines()accepts the below-described parameters:
- y : It is a required parameter for this method. This parameter describes that in the graph the line is to be drawn. Its value is a scalar or sequence of scalars, in other words, it is the y-indexes where the line is to be plotted.
- xmin: It is a required parameter that has either a scalar value or a 1D array-like value that sets the beginning of each line. If scalars are provided all the lines will have the same length.
- colors: As the name suggests it is used to set the color of the line to be plotted. This parameter is optional in nature and its default value is 'k'
- linestyles: It is also an optional parameter that accepts four values namely 'solid', 'dashed', 'dashdot' and 'dotted'. It is responsible for setting the style of the line to be plotted.
- label: It is an optional parameter used to describe information about the plotted line in the same line. This accepts a string whose default value is an empty string.
- **kwargs: This parameter is used to make use of LineCollection properties in the plotted line.
Note: In addition to the above-mentioned parameters, this method can take a data keyword argument. It is also important to note that the object passed as data must support item access and membership test.Example 1:
Python3 1== `
from matplotlib import pyplot as plt
plt.hlines(y = 1, xmin = 1, xmax = 4)
plt.hlines(y = 1.6, xmin = 1.5, xmax = 4.5)
plt.hlines(y = 2, xmin = 2, xmax = 5)
`
Output : 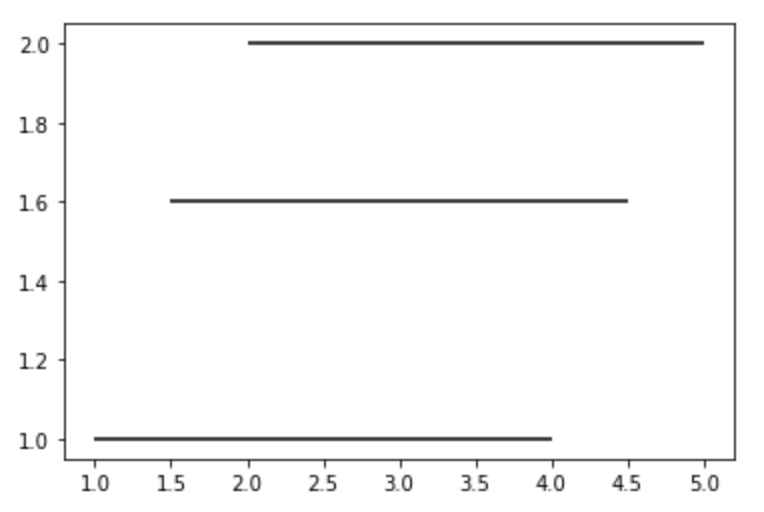 Example 2:
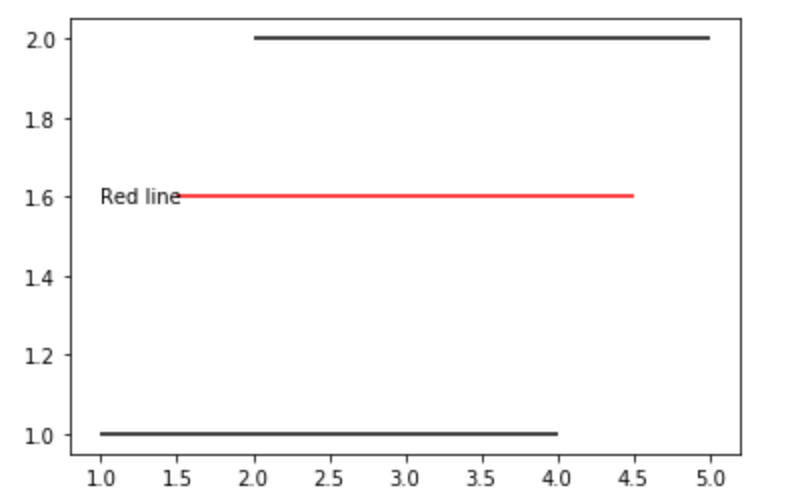
Python3 1== `
from matplotlib import pyplot as plt
plt.hlines(y = 1, xmin = 1, xmax = 4, label ="black line")
plt.hlines(y = 1.6, xmin = 1.5, xmax = 4.5, color ='r') plt.text(1, 1.6, 'Red line', ha ='left', va ='center')
plt.hlines(y = 2, xmin = 2, xmax = 5)
`
Output :