Matplotlib.pyplot.savefig() in Python (original) (raw)
Last Updated : 03 Apr, 2025
**savefig() function in Python is used to save a plot created with Matplotlib to a file. It supports various formats like PNG, PDF, SVG, and more. This method allows you to specify additional parameters like file name, resolution, layout, and transparency, giving you control over the appearance and quality of the saved image. Example:
Python `
import matplotlib.pyplot as plt import numpy as np
x = np.linspace(0, 10, 100) y = np.sin(x)
plt.plot(x, y) plt.title('Sine Wave')
Save the plot as a PNG file
plt.savefig('sine_wave.png') plt.show()
`
**Output
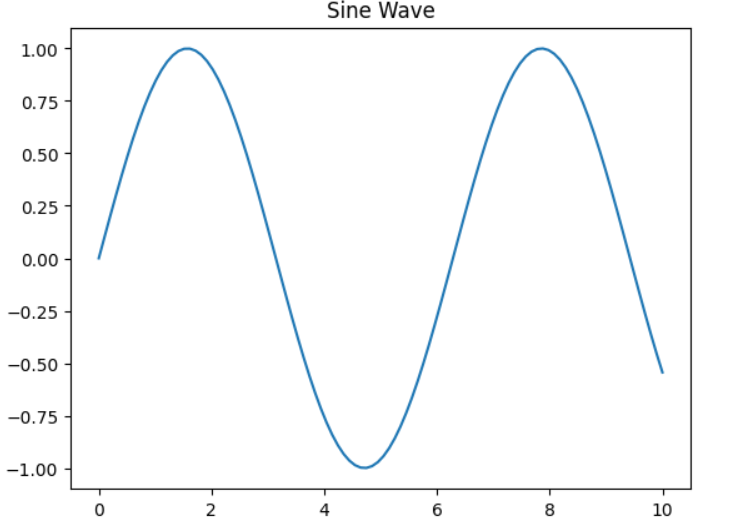
Saving a Sine Wave
**Explanation:
- The plot is created using plt.plot() with a simple sine wave.
- plt.savefig(‘sine_wave.png’) saves the plot as a PNG file named ‘sine_wave.png’.
Syntax
savefig(fname, *, transparent=None, dpi=’figure’, format=None,
metadata=None, bbox_inches=None, pad_inches=0.1,
facecolor=’auto’, edgecolor=’auto’, backend=None,
**kwargs
)
**Parameters:
- **fname: Required. The filename or path where the figure will be saved (e.g., ‘plot.png’).
- **transparent: If True, saves the figure with a transparent background. Default is None.
- **dpi: The resolution in dots per inch. Default is ‘figure’ (uses the figure’s current DPI).
- **format: The file format (e.g., ‘png’, ‘pdf’, ‘svg’). Default is None (inferred from file extension).
- **metadata: A dictionary of metadata to embed in the saved file (e.g., {‘author’: ‘Author Name’}).
- **bbox_inches: Specifies the bounding box of the saved figure. Set to ‘tight’ to crop the image tightly.
- **pad_inches: Padding around the figure when bbox_inches=’tight’. Default is 0.1.
- **facecolor: The background color of the figure. Default is ‘auto’.
- **edgecolor: The color of the figure’s edge (border). Default is ‘auto’.
- **backend: Specifies the backend to use when saving the figure. Default is None.
- ****kwargs: Additional keyword arguments for further customization (e.g., orientation, quality, etc.).
**Return Value: savefig() function does not return any value. It saves the figure to the specified file path and does not provide a return object. Therefore, it returns None.
Examples of Matplotlib.pyplot.savefig()
Example 1: Simple Line Plot and Saving with savefig()
This code demonstrates how to create a simple line plot using matplotlib.pyplot in Python. It plots a set of x-values (x) and y-values (y) on a graph, labels the axes, saves the plot as an image file (squares.png), and displays the plot.
Python `
import matplotlib.pyplot as plt
x =[1, 4, 9, 16, 25, 36, 49, 64, 81, 100] y =[1, 2, 3, 4, 5, 6, 7, 8, 9, 10]
plotting
plt.plot(x, y) plt.xlabel("X") plt.ylabel("Y")
plt.savefig("squares.png")
plt.show()
`
**Output
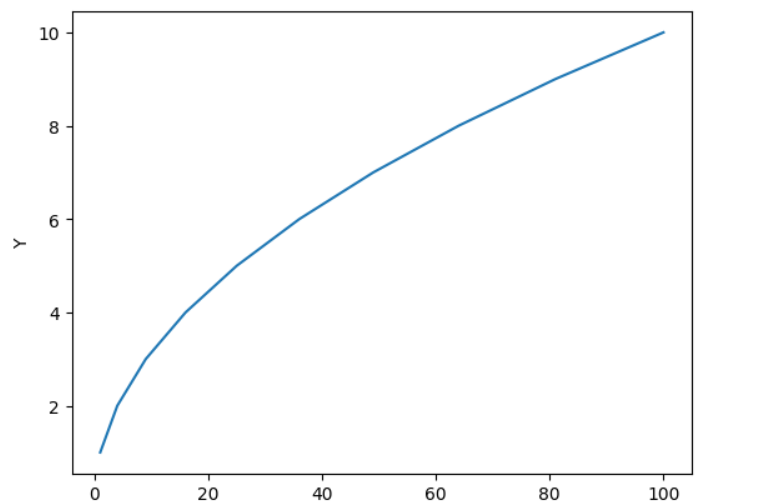
Saving a Simple Line Plot
**Explanation:
- plt.plot() creates a line plot.
- plt.xlabel() and plt.ylabel() label the axes.
- plt.savefig(“squares.png”) saves the plot as a PNG image.
- plt.show() displays the plot.
Example 2: Saving a Histogram Plot with Custom Parameters
This code demonstrates how to create a histogram using matplotlib.pyplot in Python. It plots the values from the list x as a histogram, saves the figure with customized settings, and then displays the plot.
Python `
import matplotlib.pyplot as plt
x =[1, 4, 9, 16, 25, 36, 49, 64, 81, 100] plt.hist(x)
saving the figure.
plt.savefig("squares1.png", bbox_inches ="tight", pad_inches = 1, transparent = True, facecolor ="g", edgecolor ='w', orientation ='landscape')
plt.show()
`
**Output

Saving a Histogram
**Explanation:
- **x contains the squares of integers, and the code creates a histogram to visualize the distribution of these values.
- **plt.hist(x) generates the histogram plot.
- **plt.savefig(“squares1.png”) saves the figure as a PNG file with customized options like tight bounding box, padding, transparent background, green face color, white edge color, and landscape orientation.