Matplotlib.pyplot.show() in Python (original) (raw)
Last Updated : 11 Apr, 2020
Matplotlib is a library in Python and it is numerical – mathematical extension for NumPy library. Pyplot is a state-based interface to a Matplotlib module which provides a MATLAB-like interface.
Sample Code –
import matplotlib.pyplot as plt
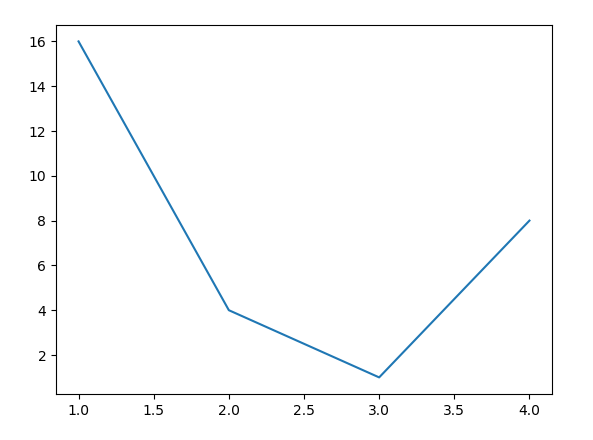
plt.plot([ 1 , 2 , 3 , 4 ], [ 16 , 4 , 1 , 8 ])
plt.show()
Output:
matplotlib.pyplot.show() Function
The show() function in pyplot module of matplotlib library is used to display all figures.
Syntax:
matplotlib.pyplot.show(*args, **kw)
Parameters: This method accepts only one parameter which is discussed below:
- block : This parameter is used to override the blocking behavior described above.
Returns: This method does not return any value.
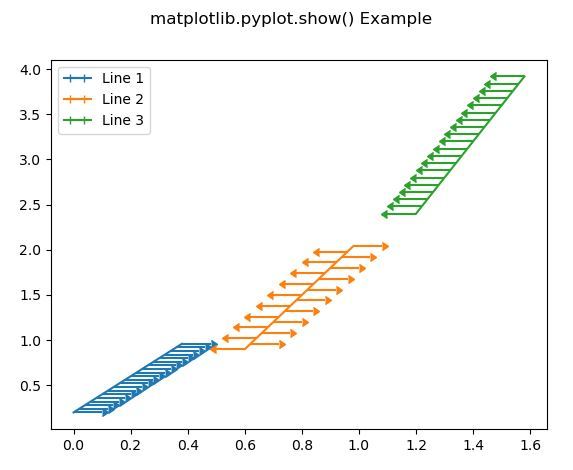
Below examples illustrate the matplotlib.pyplot.show() function in matplotlib.pyplot:
Example #1:
import matplotlib.pyplot as plt
import numpy as np
fig = plt.figure()
x = np.arange( 20 ) / 50
y = (x + 0.1 ) * 2
val1 = [ True , False ] * 10
val2 = [ False , True ] * 10
plt.errorbar(x, y,
`` xerr = 0.1 ,
`` xlolims = True ,
`` label = 'Line 1' )
y = (x + 0.3 ) * 3
plt.errorbar(x + 0.6 , y,
`` xerr = 0.1 ,
`` xuplims = val1,
`` xlolims = val2,
`` label = 'Line 2' )
y = (x + 0.6 ) * 4
plt.errorbar(x + 1.2 , y,
`` xerr = 0.1 ,
`` xuplims = True ,
`` label = 'Line 3' )
plt.legend()
fig.suptitle( 'matplotlib.pyplot.show() Example' )
plt.show()
Output:
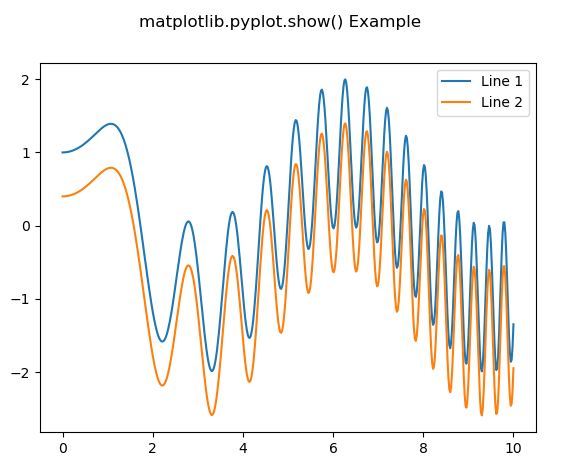
Example #2:
import numpy as np
import matplotlib.pyplot as plt
x = np.linspace( 0 , 10 , 500 )
y = np.sin(x * * 2 ) + np.cos(x)
fig, ax = plt.subplots()
ax.plot(x, y, label = 'Line 1' )
ax.plot(x, y - 0.6 , label = 'Line 2' )
ax.legend()
fig.suptitle( 'matplotlib.pyplot.show() Example' )
plt.show()
Output:
Similar Reads
- Matplotlib.pyplot.sci() in Python Matplotlib is a library in Python and it is numerical - mathematical extension for NumPy library. Pyplot is a state-based interface to a Matplotlib module which provides a MATLAB-like interface. There are various plots which can be used in Pyplot are Line Plot, Contour, Histogram, Scatter, 3D Plot, 2 min read
- Matplotlib.pyplot.sca() in Python Matplotlib is a library in Python and it is numerical – mathematical extension for NumPy library. Pyplot is a state-based interface to a Matplotlib module which provides a MATLAB-like interface. There are various plots which can be used in Pyplot are Line Plot, Contour, Histogram, Scatter, 3D Plot, 1 min read
- Matplotlib.pyplot.twiny() in Python Matplotlib is a library in Python and it is numerical - mathematical extension for NumPy library. Pyplot is a state-based interface to a Matplotlib module which provides a MATLAB-like interface. Sample Code # sample code import matplotlib.pyplot as plt plt.plot([1, 2, 3, 4], [16, 4, 1, 8]) plt.show( 2 min read
- Matplotlib.pyplot.twinx() in Python Matplotlib is a library in Python and it is numerical - mathematical extension for NumPy library. Pyplot is a state-based interface to a Matplotlib module which provides a MATLAB-like interface. Sample Code # sample code import matplotlib.pyplot as plt plt.plot([1, 2, 3, 4], [16, 4, 1, 8]) plt.show( 2 min read
- Matplotlib.pyplot.yticks() in Python Matplotlib is a library in Python and it is numerical - mathematical extension for NumPy library. Pyplot is a state-based interface to a Matplotlib module which provides a MATLAB-like interface. Matplotlib.pyplot.yticks() Function The annotate() function in pyplot module of matplotlib library is use 2 min read
- Matplotlib.pyplot.xlim() in Python Matplotlib is a library in Python and it is numerical - mathematical extension for NumPy library. Pyplot is a state-based interface to a Matplotlib module which provides a MATLAB-like interface. There are various plots which can be used in Pyplot are Line Plot, Contour, Histogram, Scatter, 3D Plot, 2 min read
- Matplotlib.pyplot.ylim() in Python Matplotlib is a library in Python and it is numerical - mathematical extension for NumPy library. Pyplot is a state-based interface to a Matplotlib module which provides a MATLAB-like interface. matplotlib.pyplot.ylim() Function The ylim() function in pyplot module of matplotlib library is used to g 2 min read
- Matplotlib.pyplot.xticks() in Python matplotlib.pyplot.xticks() function is used to get or set the x-axis ticks in a plot. This function allows you to modify the labels and positions of the ticks along the x-axis, providing greater flexibility and control over your plots. Let's see an example to better understand this. Example: Set Cus 3 min read
- Matplotlib.pyplot.semilogx() in Python Data Visualization Is an important part of analyzing the data as plotting graphs helps in providing better insight and understanding of the problem. Matplotlib.pyplot is one of the most commonly used libraries to do the same. It helps in creating attractive data and is super easy to use. Matplotlib 8 min read
- Matplotlib.pyplot.yscale() in Python Matplotlib Is a library in Python and it is a numerical - mathematical extension for the NumPy library. Pyplot Is a state-based interface to a Matplotlib module which provides a MATLAB-like interface. matplotlib.pyplot.yscale() in Python The matplotlib.pyplot.yscale() function in pyplot module of ma 2 min read