Matplotlib.pyplot.stackplot() in Python (original) (raw)
Last Updated : 25 Apr, 2025
Matplotlib is a visualization library available in Python. Pyplot contains various functions that help matplotlib behave like MATLAB. It is used as matplotlib.pyplot for plotting figures, creating areas, lines, etc.
Stackplot
Among so many functions provided by pyplot one is stackplot which will be discussed in this article. Stackplot is used to draw a stacked area plot. It displays the complete data for visualization. It shows each part stacked onto one another and how each part makes the complete figure. It displays various constituents of data and it behaves like a pie chart. It has x-label, y-label, and title in which various parts can be represented by different colors.
The idea of stack plots is to show “parts to the whole” over time. It is used to represent various datasets without overlapping over each other.
| Parameter | Value | Use |
|---|---|---|
| x | 1-D Array | It is 1 D array with N Dimensions used to give values to X-axis |
| y | 2-D array | Represents 2 D array of M*N Dimension which is unstacked. |
| Colors | Contains List or tuple of Colors | It is used to give range of colors to represent data with default value is None. |
| Baseline | {‘zero’, ‘sym’, ‘wiggle’, ‘weighted_wiggle’} | Zero means constant baseline. Sym which is symmetric around zero value. wiggle it will minimize value of the sum of squares. |
| **kwargs | List of other keywords | Other Arguments or keywords. |
Syntax:
matplotlib.pyplot.stackplot(x, *args, labels=(), colors=None, baseline=’zero’, data=None, **kwargs)
Example #1 : Using Stackplot
The code describes the x-axis as number of days from Monday to Friday while Y-axis is represented by No of Study and playing time is represented by red and cyan color respectively.
Python3
import matplotlib.pyplot as plt
days = [ 1 , 2 , 3 , 4 , 5 ]
Studying = [ 7 , 8 , 6 , 11 , 7 ]
playing = [ 8 , 5 , 7 , 8 , 13 ]
plt.stackplot(days, Studying, playing,
`` colors = [ 'r' , 'c' ])
plt.xlabel( 'Days' )
plt.ylabel( 'No of Hours' )
plt.title('Representation of Study and \
Playing wrt to Days')
plt.show()
Output:

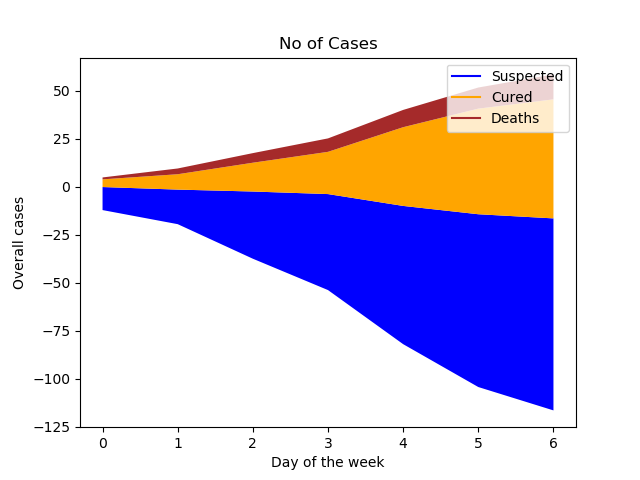
Example #2 : Using Stackplot
Python3
import matplotlib.pyplot as plt
days = [x for x in range ( 0 , 7 )]
Suspected = [ 12 , 18 , 35 , 50 , 72 , 90 , 100 ]
Cured = [ 4 , 8 , 15 , 22 , 41 , 55 , 62 ]
Deaths = [ 1 , 3 , 5 , 7 , 9 , 11 , 13 ]
plt.plot([], [], color = 'blue' ,
`` label = 'Suspected' )
plt.plot([], [], color = 'orange' ,
`` label = 'Cured' )
plt.plot([], [], color = 'brown' ,
`` label = 'Deaths' )
plt.stackplot(days, Suspected, Cured,
`` Deaths, baseline = 'zero' ,
`` colors = [ 'blue' , 'orange' ,
`` 'brown' ])
plt.legend()
plt.title( 'No of Cases' )
plt.xlabel( 'Day of the week' )
plt.ylabel( 'Overall cases' )
plt.show()
Output:
Below represents the output of graph if the value of baseline is set to zero

Below represents the output of graph if the value of baseline is set to sym

Below represents the output of graph if the value of baseline is set to wiggle
Below represents the output of graph if the value of baseline is set to weighted_wiggle

Similar Reads
- Matplotlib.pyplot.triplot() in python Matplotlib is a library in Python and it is numerical - mathematical extension for NumPy library. Pyplot is a state-based interface to a Matplotlib module which provides a MATLAB-like interface. There are various plots which can be used in Pyplot are Line Plot, Contour, Histogram, Scatter, 3D Plot, 2 min read
- Matplotlib.pyplot.sci() in Python Matplotlib is a library in Python and it is numerical - mathematical extension for NumPy library. Pyplot is a state-based interface to a Matplotlib module which provides a MATLAB-like interface. There are various plots which can be used in Pyplot are Line Plot, Contour, Histogram, Scatter, 3D Plot, 2 min read
- Matplotlib.pyplot.sca() in Python Matplotlib is a library in Python and it is numerical – mathematical extension for NumPy library. Pyplot is a state-based interface to a Matplotlib module which provides a MATLAB-like interface. There are various plots which can be used in Pyplot are Line Plot, Contour, Histogram, Scatter, 3D Plot, 1 min read
- Matplotlib.pyplot.yticks() in Python Matplotlib is a library in Python and it is numerical - mathematical extension for NumPy library. Pyplot is a state-based interface to a Matplotlib module which provides a MATLAB-like interface. Matplotlib.pyplot.yticks() Function The annotate() function in pyplot module of matplotlib library is use 2 min read
- Matplotlib.pyplot.stem() in Python Matplotlib is a visualization library in Python for 2D plots of arrays. Matplotlib is a multi-platform data visualization library built on NumPy arrays and designed to work with the broader SciPy stack. matplotlib.pyplot.stem() matplotlib.pyplot.stem() creates stem plots. A Stem plot plots vertical 3 min read
- Matplotlib.pyplot.show() in Python Matplotlib is a library in Python and it is numerical - mathematical extension for NumPy library. Pyplot is a state-based interface to a Matplotlib module which provides a MATLAB-like interface. Sample Code - # sample code import matplotlib.pyplot as plt plt.plot([1, 2, 3, 4], [16, 4, 1, 8]) plt.sho 2 min read
- Matplotlib.pyplot.xticks() in Python matplotlib.pyplot.xticks() function is used to get or set the x-axis ticks in a plot. This function allows you to modify the labels and positions of the ticks along the x-axis, providing greater flexibility and control over your plots. Let's see an example to better understand this. Example: Set Cus 3 min read
- Matplotlib.pyplot.yscale() in Python Matplotlib Is a library in Python and it is a numerical - mathematical extension for the NumPy library. Pyplot Is a state-based interface to a Matplotlib module which provides a MATLAB-like interface. matplotlib.pyplot.yscale() in Python The matplotlib.pyplot.yscale() function in pyplot module of ma 2 min read
- Matplotlib.pyplot.subplot_tool() in Python Matplotlib is a library in Python and it is numerical - mathematical extension for NumPy library. Pyplot is a state-based interface to a Matplotlib module which provides a MATLAB-like interface. Sample Code # sample code import matplotlib.pyplot as plt plt.plot([1, 2, 3, 4], [16, 4, 1, 8]) plt.show( 1 min read
- Matplotlib.pyplot.subplot2grid() in python Matplotlib is an amazing visualization library in Python for 2D plots of arrays. Matplotlib is a multi-platform data visualization library built on NumPy arrays and designed to work with the broader SciPy stack. Matplotlib.pyplot.subplot2grid() The Matplotlib.pyplot.subplot2grid() function give addi 3 min read