Matplotlib.pyplot.subplot2grid() in python (original) (raw)
Last Updated : 19 Apr, 2020
Matplotlib is an amazing visualization library in Python for 2D plots of arrays. Matplotlib is a multi-platform data visualization library built on NumPy arrays and designed to work with the broader SciPy stack.
Matplotlib.pyplot.subplot2grid()
The Matplotlib.pyplot.subplot2grid() function give additional flexibility in creating axes object at a specified location inside a grid. It also helps in spanning the axes object across multiple rows or columns. In simpler words, this function is used to create multiple charts within the same figure. It is a sub-figure layout manager.
Syntax : Plt.subplot2grid(shape, location, rowspan, colspan)
Parameters :
- shape: As the name suggests it is used to define the shape of the grid to be plotted within the graph. It is a required argument and is generally passed in as a list or tuple of two numbers which are responsible for the layout of the grid with the first number being the number of rows and the second number as the number of columns.
- location (loc): This is the second mandatory argument that this function takes. Similar to the shape argument it is also a required argument and is generally passed in as a list or tuple of two numbers. It is used for specifying the row and column number to place the sub-plot. It is also important to note that the indexes start from 0. So (0, 0) would be the cell in the first row and the first column of the grid.
- rowspan: Once the grid layout is set and the starting index is decided using location(loc) one can expand the selection to take up more rows with this argument. This is an optional parameter and has a default value of 1.
- colspan: Similar to rowspan it is used to expand the selection to take up more columns. It is also an optional parameter with default value of 1.
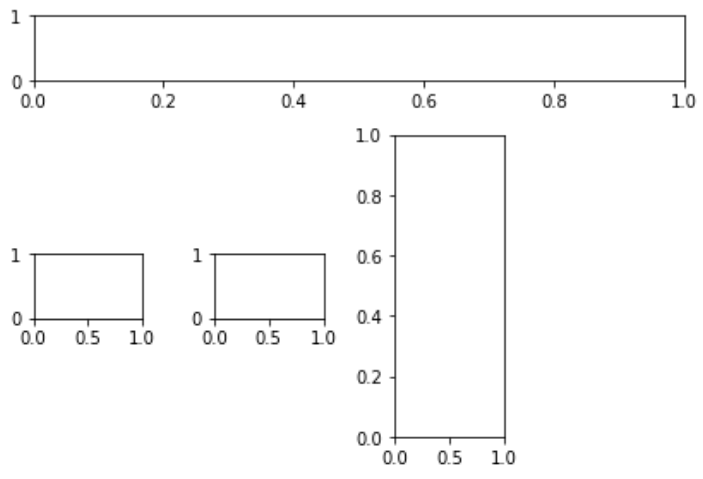
Example 1:
import matplotlib.pyplot as plt
fig = plt.figure()
axes1 = plt.subplot2grid(( 4 , 4 ), ( 0 , 0 ),
`` colspan = 4 )
axes2 = plt.subplot2grid(( 4 , 4 ), ( 1 , 0 ),
`` colspan = 3 )
axes3 = plt.subplot2grid(( 4 , 4 ), ( 1 , 2 ),
`` rowspan = 3 )
axes4 = plt.subplot2grid(( 4 , 4 ), ( 2 , 0 ))
axes5 = plt.subplot2grid(( 4 , 4 ), ( 2 , 1 ))
fig.tight_layout()
Output :
Example 2:
import random
import matplotlib.pyplot as plt
from matplotlib import style
style.use( 'fivethirtyeight' )
fig = plt.figure()
def helper():
`` xs = []
`` ys = []
`` for i in range ( 10 ):
`` x = i
`` y = random.randrange( 10 )
`` xs.append(x)
`` ys.append(y)
`` return xs, ys
axes1 = plt.subplot2grid (( 7 , 1 ), ( 0 , 0 ),
`` rowspan = 2 ,
`` colspan = 1 )
axes2 = plt.subplot2grid (( 7 , 1 ), ( 2 , 0 ),
`` rowspan = 2 ,
`` colspan = 1 )
axes3 = plt.subplot2grid (( 7 , 1 ), ( 4 , 0 ),
`` rowspan = 2 ,
`` colspan = 1 )
x, y = helper()
axes1.plot(x, y)
x, y = helper()
axes2.plot(x, y)
x, y = helper()
axes3.plot(x, y)
Output: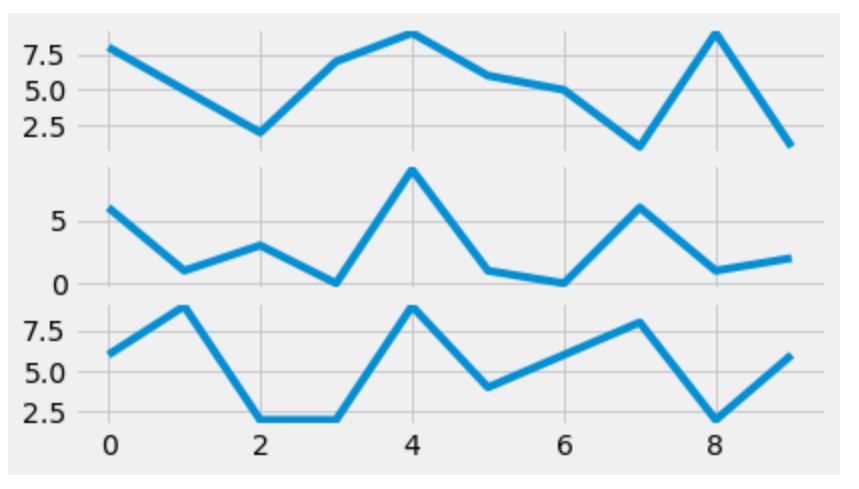
Similar Reads
- Matplotlib.pyplot.subplot_tool() in Python Matplotlib is a library in Python and it is numerical - mathematical extension for NumPy library. Pyplot is a state-based interface to a Matplotlib module which provides a MATLAB-like interface. Sample Code # sample code import matplotlib.pyplot as plt plt.plot([1, 2, 3, 4], [16, 4, 1, 8]) plt.show( 1 min read
- Matplotlib.pyplot.thetagrids() in Python Matplotlib is a plotting library of Python programming language and its numerical mathematics module is NumPy. matplotlib.pyplot is a collection of command style functions that make matplotlib work like the MATLAB Tool. Each of the pyplot functions makes certain changes to a figure: e.g., creating a 2 min read
- Matplotlib.pyplot.sci() in Python Matplotlib is a library in Python and it is numerical - mathematical extension for NumPy library. Pyplot is a state-based interface to a Matplotlib module which provides a MATLAB-like interface. There are various plots which can be used in Pyplot are Line Plot, Contour, Histogram, Scatter, 3D Plot, 2 min read
- Matplotlib.pyplot.triplot() in python Matplotlib is a library in Python and it is numerical - mathematical extension for NumPy library. Pyplot is a state-based interface to a Matplotlib module which provides a MATLAB-like interface. There are various plots which can be used in Pyplot are Line Plot, Contour, Histogram, Scatter, 3D Plot, 2 min read
- Matplotlib.pyplot.subplots_adjust() in Python Matplotlib is a library in Python and it is numerical - mathematical extension for NumPy library. Pyplot is a state-based interface to a Matplotlib module which provides a MATLAB-like interface. There are various plots which can be used in Pyplot are Line Plot, Contour, Histogram, Scatter, 3D Plot, 2 min read
- Matplotlib.pyplot.semilogx() in Python Data Visualization Is an important part of analyzing the data as plotting graphs helps in providing better insight and understanding of the problem. Matplotlib.pyplot is one of the most commonly used libraries to do the same. It helps in creating attractive data and is super easy to use. Matplotlib. 8 min read
- Matplotlib.pyplot.specgram() in Python Matplotlib is a library in Python and it is numerical - mathematical extension for NumPy library. Pyplot is a state-based interface to a Matplotlib module which provides a MATLAB-like interface. matplotlib.pyplot.specgram() Function The specgram() function in pyplot module of matplotlib library is u 3 min read
- Matplotlib.pyplot.subplot() function in Python Prerequisites: matplotlib subplot() function adds subplot to a current figure at the specified grid position. It is similar to the subplots() function however unlike subplots() it adds one subplot at a time. So to create multiple plots you will need several lines of code with the subplot() function. 2 min read
- Matplotlib.pyplot.xlim() in Python Matplotlib is a library in Python and it is numerical - mathematical extension for NumPy library. Pyplot is a state-based interface to a Matplotlib module which provides a MATLAB-like interface. There are various plots which can be used in Pyplot are Line Plot, Contour, Histogram, Scatter, 3D Plot, 2 min read
- Matplotlib.pyplot.show() in Python Matplotlib is a library in Python and it is numerical - mathematical extension for NumPy library. Pyplot is a state-based interface to a Matplotlib module which provides a MATLAB-like interface. Sample Code - # sample code import matplotlib.pyplot as plt plt.plot([1, 2, 3, 4], [16, 4, 1, 8]) plt.sho 2 min read