Matplotlib Subplots (original) (raw)
Last Updated : 23 Dec, 2024
In Matplotlib, **subplots() function simplifies the creation of multiple plots within a single figure for organized visualization of various datasets.
Before diving into subplots, let’s start with a simple plot using **matplotlib.pyplot.plot():
Python `
import matplotlib.pyplot as plt
plt.plot([1, 2, 3, 4], [16, 4, 1, 8]) plt.show()
`
**Output:

Plot using Python matplotlib
What is matplotlib.pyplot.subplots()?
The **subplots() function in **matplotlib.pyplot creates a figure with a set of subplots arranged in a grid. It allows you to easily plot multiple graphs in a single figure, making your visualizations more organized and efficient.
**Syntax: matplotlib.pyplot.subplots(nrows=1, ncols=1)
This syntax creates a figure with **nrows rows and **ncols columns of subplots.
Creating Multiple Plots with subplots()
In this example, we will use **subplots() to create two plots in a single figure.
Python `
import matplotlib.pyplot as plt import numpy as np
Plot 1:
x1 = np.array([1, 2, 3, 4]) y1 = np.array([10, 20, 25, 30])
plt.subplot(1, 2, 1) plt.plot(x1, y1)
Plot 2:
x2 = np.array([1, 2, 3, 4]) y2 = np.array([30, 25, 20, 10])
plt.subplot(1, 2, 2) plt.plot(x2, y2)
plt.show()
`
**Output:
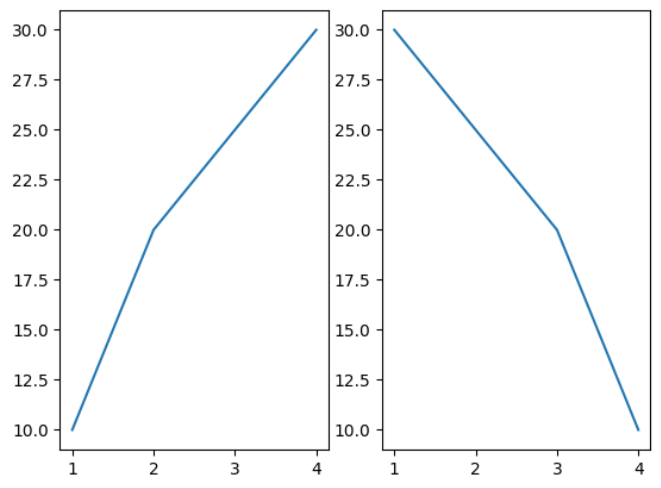
Two side-by-side plots displaying different datasets.
The subplots() function in Matplotlib allows plotting multiple plots using the same data or axes. For example, setting nrows=1 and ncols=2 creates two subplots that share the y-axis.
Python `
import matplotlib.pyplot as plt import numpy as np
x = np.array([0, 1, 2, 3]) y = np.array([3, 8, 1, 10])
fig, ax = plt.subplots(1, 2)
ax[0].plot(x, y) ax[0].set_title('Plot 1')
ax[1].plot(x, y, 'r') ax[1].set_title('Plot 2')
plt.show()
`
**Output:
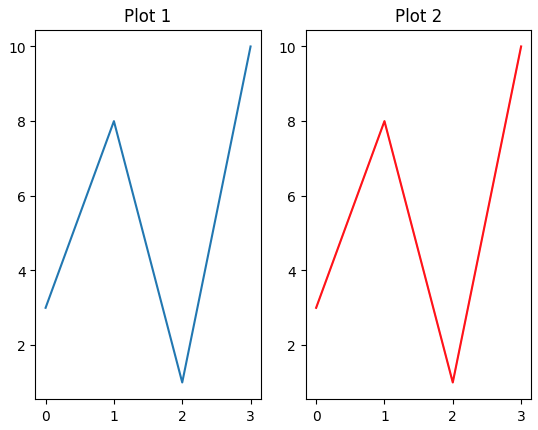
Two side-by-side plots displaying different datasets.
Stacking Subplots in Two Directions
You can stack subplots vertically and horizontally by adjusting the nrows and ncols parameters in subplots(). This example demonstrates a 2×2 grid layout.
Python `
Implementation of matplotlib function
import numpy as np import matplotlib.pyplot as plt
First create some toy data:
x = np.linspace(0, 2 * np.pi, 400) y1 = np.sin(x) y2 = np.sin(x2) y3 = y12 y4 = y2**2
fig, ax = plt.subplots(nrows=2, ncols=2) ax[0, 0].plot(x, y1, c='red') ax[0, 1].plot(x, y2, c='red') ax[1, 0].plot(x, y3, c='blue') ax[1, 1].plot(x, y3, c='blue')
ax[0, 0].set_title('Simple plot with sin(x)') ax[0, 1].set_title('Simple plot with sin(x**2)') ax[1, 0].set_title('Simple plot with sin(x)2') ax[1, 1].set_title('Simple plot with sin(x2)**2')
fig.suptitle('Stacked subplots in two direction') plt.show()
`
**Output:

A 2×2 grid of plots, each displaying different mathematical functions.
Sharing Axes Between Subplots
In some cases, you may want your subplots to share axes. This is useful when comparing datasets with similar ranges. By setting the **sharex or **sharey parameter to **True, the subplots will share their x or y axis.
**Example Code for Shared Axis:
Python `
import numpy as np import matplotlib.pyplot as plt
x = np.linspace(0, 2 * np.pi, 400) y1 = np.sin(x) y2 = np.sin(x**2)
fig, (ax1, ax2) = plt.subplots(2, sharex=True) ax1.plot(x, y1, c='red') ax2.plot(x, y2, c='red')
ax1.set_ylabel('Simple plot with sin(x)') ax2.set_ylabel('Simple plot with sin(x**2)')
fig.suptitle('Subplots with shared axis') plt.show()
`
**Output:

Subplots with shared axis
Creating Polar Plots
Matplotlib also supports polar plots. You can create them by passing a dictionary with projection=’polar’ to the **subplot_kw parameter in **subplots().
**Example Code for Polar Axis:
Python `
import numpy as np import matplotlib.pyplot as plt
x = np.linspace(0, 1.5 * np.pi, 100) y = np.sin(x2)+np.cos(x2)
fig, axs = plt.subplots(nrows=2, ncols=2, subplot_kw = dict(polar = True)) axs[0, 0].plot(x, y) axs[1, 1].scatter(x, y)
fig.suptitle('matplotlib.pyplot.subplots() Example') plt.show()
`
**Output:

matplotlib.pyplot.subplots() function example