Matplotlib.pyplot.text() function in Python (original) (raw)
Last Updated : 25 Nov, 2020
This function is used to add a text to the axes at location x, y in data coordinates.
Syntax: matplotlib.pyplot.text(x, y, s, fontdict=None, **kwargs)
| parameters | Description |
|---|---|
| x, y:float | The position to place the text. By default, this is in data coordinates. The coordinate system can be changed using the transform parameter. |
| s :str | The text. |
| fontdict : dict default none | A dictionary to override the default text properties. If fontdict is None, the defaults are determined by rcParams. |
| **kwargs | Text properties. |
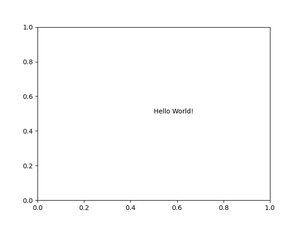
Example #1: Text on plot sheet
Python3 `
import matplotlib.pyplot
matplotlib.pyplot.text(0.5, 0.5, "Hello World!") matplotlib.pyplot.savefig("out.png")
`
Output:
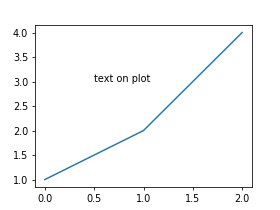
Example #2: Add text to a plot
Python3 `
import matplotlib.pyplot as plt
w = 4 h = 3 d = 70
plt.figure(figsize=(w, h), dpi=d)
x = [1, 2, 4] x_pos = 0.5 y_pos = 3
plt.text(x_pos, y_pos, "text on plot") plt.plot(x) plt.savefig("out.png")
`
Output:
Similar Reads
- Matplotlib.pyplot.setp() function in Python Matplotlib is a library in Python and it is numerical – mathematical extension for NumPy library. Pyplot is a state-based interface to a Matplotlib module which provides a MATLAB-like interface. There are various plots which can be used in Pyplot are Line Plot, Contour, Histogram, Scatter, 3D Plot, 2 min read
- Matplotlib.pyplot.suptitle() function in Python Matplotlib is a library in Python and it is a mathematical extension for NumPy library. Pyplot is a state-based interface to a Matplotlib module which provides a MATLAB-like interface. matplotlib.pyplot.suptitle() Function The suptitle() function in pyplot module of the matplotlib library is used to 3 min read
- Matplotlib.pyplot.xscale() function in Python Matplotlib is a library in Python and it is numerical – mathematical extension for NumPy library. Pyplot is a state-based interface to a Matplotlib module which provides a MATLAB-like interface. There are various plots which can be used in Pyplot are Line Plot, Contour, Histogram, Scatter, 3D Plot, 2 min read
- Matplotlib.pyplot.plot() function in Python The matplotlib.pyplot.plot() is used to create 2D plots such as line graphs and scatter plots. The plot() function allows us to plot data points, customize line styles, markers and colors making it useful for various types of visualizations. In this article, we'll see how to use this function to plo 3 min read
- Matplotlib.pyplot.fill() function in Python Matplotlib.pyplot.fill() function is used to fill the area enclosed by polygon /curve. Syntax: matplotlib.pyplot.fill(*args, data=None, **kwargs) Parameters: *args: sequence of x, y, [color] Â Â Â sequence of x,y = To traverse the boundaries of the polygon or curve defined by lists of x and y positi 2 min read
- Matplotlib.pyplot.pcolor() function in Python Matplotlib is the well-known Python package used in data visualization. Numpy is the numerical mathematics extension of Matplotlib. Matplotlib is capable of producing high-quality graphs, charts, and figures. Matplotlib produces object-oriented API for embedding plots into projects using GUI toolkit 2 min read
- Matplotlib.pyplot.hexbin() function in Python Matplotlib is a library in Python and it is numerical – mathematical extension for NumPy library. Pyplot is a state-based interface to a Matplotlib module which provides a MATLAB-like interface. There are various plots which can be used in Pyplot are Line Plot, Contour, Histogram, Scatter, 3D Plot, 2 min read
- Matplotlib.pyplot.figimage() function in Python Matplotlib is a widely used library in Python for plotting various graphs, as it provides very efficient ways and easy to understand methods for complex plots also. pyplot is a collection of command style functions that make matplotlib work like MATLAB. figimage() function matplotlib.pyplot.figimage 2 min read
- Matplotlib.pyplot.autumn() in Python Matplotlib is a library in Python and it is numerical - mathematical extension for NumPy library. Pyplot is a state-based interface to a Matplotlib module which provides a MATLAB-like interface. There are various plots which can be used in Pyplot are Line Plot, Contour, Histogram, Scatter, 3D Plot, 2 min read
- Matplotlib.pyplot.gci() in Python Matplotlib is a library in Python and it is numerical – mathematical extension for NumPy library. Pyplot is a state-based interface to a Matplotlib module which provides a MATLAB-like interface. There are various plots which can be used in Pyplot are Line Plot, Contour, Histogram, Scatter, 3D Plot, 2 min read