Matplotlib.pyplot.thetagrids() in Python (original) (raw)
Last Updated : 28 Apr, 2025
Matplotlib is a plotting library of Python programming language and its numerical mathematics module is NumPy. matplotlib.pyplot is a collection of command style functions that make matplotlib work like the MATLAB Tool. Each of the pyplot functions makes certain changes to a figure: e.g., creating a figure, creating a plot area in a figure, plots some lines in a plotting area or decorate the plot with labels, etc.
Note: For more information, refer to Pyplot in Matplotlib
Matplotlib.pyplot.thetagrids()
Set the theta locations of the gridlines in the polar plot. If no arguments are passed, it returns a tuple (lines, labels) where lines are an array of radial gridlines (Line2D instances) and labels is an array of tick labels (Text instances):
Syntax: lines, labels = thetagrids(angles, labels=None, fmt='%d', frac = 1.5)
Parameters:
- Angles:
set the angles to the place of theta grids (these gridlines are equal along the theta dimension)
- labels:
if not None, then it is len(angles) or list of strings of the labels to use at each angle. If labels are None, the labels will be fmt%angle.
- frac: It is the fraction of the polar axes radius at the place of label (1 is the edge). e.g., 1.25 is outside the axes and 0.75 is inside the axes.
Return Type: Return value is a list of tuples (lines, labels)
Note: lines are Line2D instances, labels are Text instances.
Example:
Python3 `
import matplotlib.pyplot as plt import numpy as np
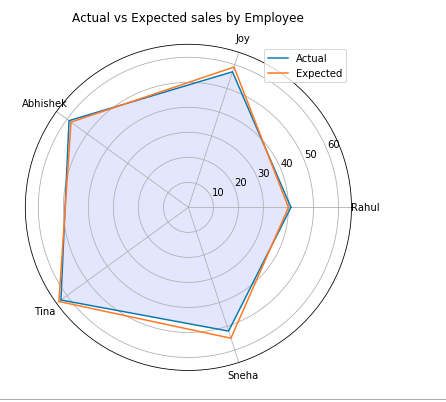
employee = ["Rahul", "Joy", "Abhishek", "Tina", "Sneha"]
actual = [41, 57, 59, 63, 52, 41] expected = [40, 59, 58, 64, 55, 40]
Initializing the spiderplot by
setting figure size and polar
projection
plt.figure(figsize =(10, 6)) plt.subplot(polar = True)
theta = np.linspace(0, 2 * np.pi, len(actual))
Arranging the grid into number
of sales into equal parts in
degrees
lines, labels = plt.thetagrids(range(0, 360, int(360/len(employee))), (employee))
Plot actual sales graph
plt.plot(theta, actual) plt.fill(theta, actual, 'b', alpha = 0.1)
Plot expected sales graph
plt.plot(theta, expected)
Add legend and title for the plot
plt.legend(labels =('Actual', 'Expected'), loc = 1) plt.title("Actual vs Expected sales by Employee")
Display the plot on the screen
plt.show()
`
Output: