Matplotlib.pyplot.triplot() in python (original) (raw)
Last Updated : 19 Apr, 2020
Matplotlib is a library in Python and it is numerical – mathematical extension for NumPy library. Pyplot is a state-based interface to a Matplotlib module which provides a MATLAB-like interface. There are various plots which can be used in Pyplot are Line Plot, Contour, Histogram, Scatter, 3D Plot, etc.
matplotlib.pyplot.triplot() Function:
The triplot() function in pyplot module of matplotlib library is used to draw a unstructured triangular grid as lines and/or markers.
Syntax: matplotlib.pyplot.triplot(*args, **kwargs)
Parameters: This method accept the following parameters that are described below:
- x, y: These parameter are the x and y coordinates of the data which is to be plot.
- triangulation: This parameter is a matplotlib.tri.Triangulation object.
- **kwargs: This parameter is Text properties that is used to control the appearance of the labels.
All remaining args and kwargs are the same as for matplotlib.pyplot.plot().
Returns: This returns the list of 2 Line2D containing following:
- The lines plotted for triangles edges.
- The markers plotted for triangles nodes
Below examples illustrate the matplotlib.pyplot.triplot() function in matplotlib.pyplot:
Example 1:
import matplotlib.pyplot as plt
import matplotlib.tri as mtri
import numpy as np
x = np.asarray([ 0 , 1 , 2 , 3 , 0.5 , 1.5 ,
`` 2.5 , 1 , 2 , 1.5 ])
y = np.asarray([ 0 , 0 , 0 , 0 , 1.0 ,
`` 1.0 , 1.0 , 2 , 2 , 3.0 ])
triangles = [[ 0 , 1 , 4 ], [ 1 , 2 , 5 ],
`` [ 2 , 3 , 6 ], [ 1 , 5 , 4 ],
`` [ 2 , 6 , 5 ], [ 4 , 5 , 7 ],
`` [ 5 , 6 , 8 ], [ 5 , 8 , 7 ],
`` [ 7 , 8 , 9 ]]
triang = mtri.Triangulation(x, y, triangles)
z = np.cos( 1.5 * x) * np.cos( 1.5 * y)
plt.tricontourf(triang, z)
plt.triplot(triang, 'go-' )
plt.title( 'matplotlib.pyplot.triplot() Example' )
plt.show()
Output:
Example 2:
import matplotlib.pyplot as plt
import matplotlib.tri as tri
import numpy as np
n_angles = 24
n_radii = 9
min_radius = 0.5
radii = np.linspace(min_radius, 0.9 ,
`` n_radii)
angles = np.linspace( 0 , 3 * np.pi, n_angles,
`` endpoint = False )
angles = np.repeat(angles[..., np.newaxis],
`` n_radii, axis = 1 )
angles[:, 1 :: 2 ] + = np.pi / n_angles
x = (radii * np.cos(angles)).flatten()
y = (radii * np.sin(angles)).flatten()
triang = tri.Triangulation(x, y)
triang.set_mask(np.hypot(x[triang.triangles].mean(axis = 1 ),
`` y[triang.triangles].mean(axis = 1 ))
`` < min_radius)
plt.triplot(triang, 'go-' , lw = 1 )
plt.title( 'matplotlib.pyplot.triplot() Example' )
plt.show()
Output: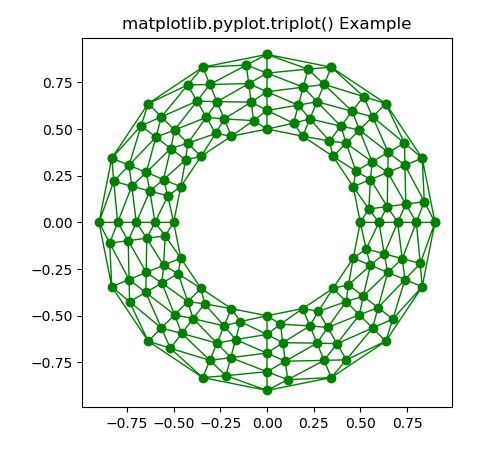
Similar Reads
- Matplotlib.pyplot.tripcolor() in Python Matplotlib is a library in Python and it is numerical - mathematical extension for NumPy library. Pyplot is a state-based interface to a Matplotlib module which provides a MATLAB-like interface. Sample Code # sample code import matplotlib.pyplot as plt plt.plot([1, 2, 3, 4], [16, 4, 1, 8]) plt.show( 4 min read
- Matplotlib.pyplot.stackplot() in Python Matplotlib is a visualization library available in Python. Pyplot contains various functions that help matplotlib behave like MATLAB. It is used as matplotlib.pyplot for plotting figures, creating areas, lines, etc. Stackplot Among so many functions provided by pyplot one is stackplot which will be 3 min read
- Matplotlib.pyplot.title() in Python The title() method in the Matplotlib module is used to specify the title of the visualization depicted and display the title using various attributes. In this article, we will learn about this function with the help of examples. Syntax: matplotlib.pyplot.title(label, fontdict=None, loc='center', pad 3 min read
- Matplotlib.pyplot.tricontour() in Python Matplotlib is a library in Python and it is numerical - mathematical extension for NumPy library. Pyplot is a state-based interface to a Matplotlib module which provides a MATLAB-like interface. There are various plots which can be used in Pyplot are Line Plot, Contour, Histogram, Scatter, 3D Plot, 3 min read
- Matplotlib.pyplot.violinplot() in Python Matplotlib is an amazing visualization library in Python for 2D plots of arrays. Matplotlib is a multi-platform data visualization library built on NumPy arrays and designed to work with the broader SciPy stack. Matplotlib.pyplot.violinplot() The matplotlib.pyplot.violinplot() is as the name explain 4 min read
- Matplotlib.pyplot.tricontourf() in Python Matplotlib is a library in Python and it is numerical - mathematical extension for NumPy library. Pyplot is a state-based interface to a Matplotlib module which provides a MATLAB-like interface.  Matplotlib.pyplot.tricontourf() The tricontourf() function in pyplot module of matplotlib library is us 2 min read
- Matplotlib.pyplot.sci() in Python Matplotlib is a library in Python and it is numerical - mathematical extension for NumPy library. Pyplot is a state-based interface to a Matplotlib module which provides a MATLAB-like interface. There are various plots which can be used in Pyplot are Line Plot, Contour, Histogram, Scatter, 3D Plot, 2 min read
- Matplotlib.pyplot.twiny() in Python Matplotlib is a library in Python and it is numerical - mathematical extension for NumPy library. Pyplot is a state-based interface to a Matplotlib module which provides a MATLAB-like interface. Sample Code # sample code import matplotlib.pyplot as plt plt.plot([1, 2, 3, 4], [16, 4, 1, 8]) plt.show( 2 min read
- Matplotlib.pyplot.twinx() in Python Matplotlib is a library in Python and it is numerical - mathematical extension for NumPy library. Pyplot is a state-based interface to a Matplotlib module which provides a MATLAB-like interface. Sample Code # sample code import matplotlib.pyplot as plt plt.plot([1, 2, 3, 4], [16, 4, 1, 8]) plt.show( 2 min read
- Matplotlib.pyplot.xlim() in Python Matplotlib is a library in Python and it is numerical - mathematical extension for NumPy library. Pyplot is a state-based interface to a Matplotlib module which provides a MATLAB-like interface. There are various plots which can be used in Pyplot are Line Plot, Contour, Histogram, Scatter, 3D Plot, 2 min read