Matplotlib.pyplot.twinx() in Python (original) (raw)
Last Updated : 11 Apr, 2020
Matplotlib is a library in Python and it is numerical – mathematical extension for NumPy library. Pyplot is a state-based interface to a Matplotlib module which provides a MATLAB-like interface.
Sample Code
import matplotlib.pyplot as plt
plt.plot([ 1 , 2 , 3 , 4 ], [ 16 , 4 , 1 , 8 ])
plt.show()
Output:
matplotlib.pyplot.twinx() Function
The twinx() function in pyplot module of matplotlib library is used to make and return a second axes that shares the x-axis.
Syntax:
matplotlib.pyplot.twinx(ax=None)
Parameters: This method does not accepts any parameters.
Returns: This returns the second axes that shares the x-axis
Below examples illustrate the matplotlib.pyplot.twinx() function in matplotlib.pyplot:
Example #1:
import matplotlib.pyplot as plt
import numpy as np
def GFG1(temp):
`` return ( 5. / 9. ) * (temp - 32 )
def GFG2(ax1):
`` y1, y2 = ax1.get_ylim()
`` ax_twin .set_ylim(GFG1(y1), GFG1(y2))
`` ax_twin .figure.canvas.draw()
fig, ax1 = plt.subplots()
ax_twin = ax1.twinx()
ax1.callbacks.connect( "ylim_changed" , GFG2)
ax1.plot(np.linspace( 0 , 120 , 100 ))
ax1.set_xlim( 30 , 100 )
ax1.set_ylabel( 'Fahrenheit' )
ax_twin .set_ylabel( 'Celsius' )
fig.suptitle('matplotlib.pyplot.twinx() function \
Example\n\n', fontweight = "bold" )
plt.show()
Output: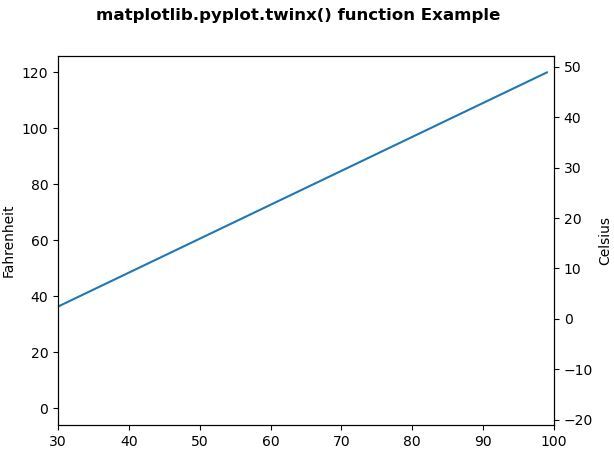
Example #2:
import numpy as np
import matplotlib.pyplot as plt
t = np.arange( 0.01 , 20.0 , 0.001 )
data1 = np.exp(t)
data2 = np.sin( 0.3 * np.pi * t)
fig, ax1 = plt.subplots()
color = 'tab:blue'
ax1.set_xlabel( 'time (s)' )
ax1.set_ylabel( 'exp' , color = color)
ax1.plot(t, data1, color = color)
ax1.tick_params(axis = 'y' , labelcolor = color)
ax2 = ax1.twinx()
color = 'tab:green'
ax2.set_ylabel( 'sin' , color = color)
ax2.plot(t, data2, color = color)
ax2.tick_params(axis = 'y' , labelcolor = color)
fig.suptitle('matplotlib.pyplot.twinx() function \
Example\n\n', fontweight = "bold" )
plt.show()
Output: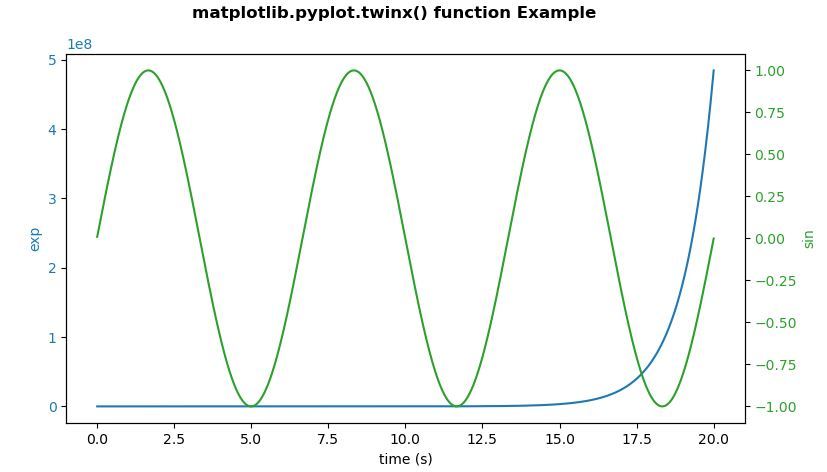
Similar Reads
- Matplotlib.pyplot.twiny() in Python Matplotlib is a library in Python and it is numerical - mathematical extension for NumPy library. Pyplot is a state-based interface to a Matplotlib module which provides a MATLAB-like interface. Sample Code # sample code import matplotlib.pyplot as plt plt.plot([1, 2, 3, 4], [16, 4, 1, 8]) plt.show( 2 min read
- Matplotlib.pyplot.sci() in Python Matplotlib is a library in Python and it is numerical - mathematical extension for NumPy library. Pyplot is a state-based interface to a Matplotlib module which provides a MATLAB-like interface. There are various plots which can be used in Pyplot are Line Plot, Contour, Histogram, Scatter, 3D Plot, 2 min read
- Matplotlib.pyplot.yticks() in Python Matplotlib is a library in Python and it is numerical - mathematical extension for NumPy library. Pyplot is a state-based interface to a Matplotlib module which provides a MATLAB-like interface. Matplotlib.pyplot.yticks() Function The annotate() function in pyplot module of matplotlib library is use 2 min read
- Matplotlib.pyplot.xticks() in Python matplotlib.pyplot.xticks() function is used to get or set the x-axis ticks in a plot. This function allows you to modify the labels and positions of the ticks along the x-axis, providing greater flexibility and control over your plots. Let's see an example to better understand this. Example: Set Cus 3 min read
- Matplotlib.pyplot.xlim() in Python Matplotlib is a library in Python and it is numerical - mathematical extension for NumPy library. Pyplot is a state-based interface to a Matplotlib module which provides a MATLAB-like interface. There are various plots which can be used in Pyplot are Line Plot, Contour, Histogram, Scatter, 3D Plot, 2 min read
- Matplotlib.pyplot.show() in Python Matplotlib is a library in Python and it is numerical - mathematical extension for NumPy library. Pyplot is a state-based interface to a Matplotlib module which provides a MATLAB-like interface. Sample Code - # sample code import matplotlib.pyplot as plt plt.plot([1, 2, 3, 4], [16, 4, 1, 8]) plt.sho 2 min read
- Matplotlib.pyplot.ylim() in Python Matplotlib is a library in Python and it is numerical - mathematical extension for NumPy library. Pyplot is a state-based interface to a Matplotlib module which provides a MATLAB-like interface. matplotlib.pyplot.ylim() Function The ylim() function in pyplot module of matplotlib library is used to g 2 min read
- Matplotlib.pyplot.xkcd() in Python One of the main process in Data Science is Data Visualization. Data Visualization refers to present a dataset in the form of graphs and pictures. We can identify upcoming trend by observing these Graphs. Python provides us with an amazing Data Visualization library in it which is Matplotlib which wa 2 min read
- Matplotlib.pyplot.triplot() in python Matplotlib is a library in Python and it is numerical - mathematical extension for NumPy library. Pyplot is a state-based interface to a Matplotlib module which provides a MATLAB-like interface. There are various plots which can be used in Pyplot are Line Plot, Contour, Histogram, Scatter, 3D Plot, 2 min read
- Matplotlib.pyplot.sca() in Python Matplotlib is a library in Python and it is numerical – mathematical extension for NumPy library. Pyplot is a state-based interface to a Matplotlib module which provides a MATLAB-like interface. There are various plots which can be used in Pyplot are Line Plot, Contour, Histogram, Scatter, 3D Plot, 1 min read