Matplotlib.pyplot.xticks() in Python (original) (raw)
Last Updated : 01 Apr, 2025
**matplotlib.pyplot.xticks() function is used to get or set the x-axis ticks in a plot. This function allows you to modify the labels and positions of the ticks along the x-axis, providing greater flexibility and control over your plots. Let's see an example to better understand this.
**Example: Set Custom Tick Positions and Labels
Python `
import matplotlib.pyplot as plt
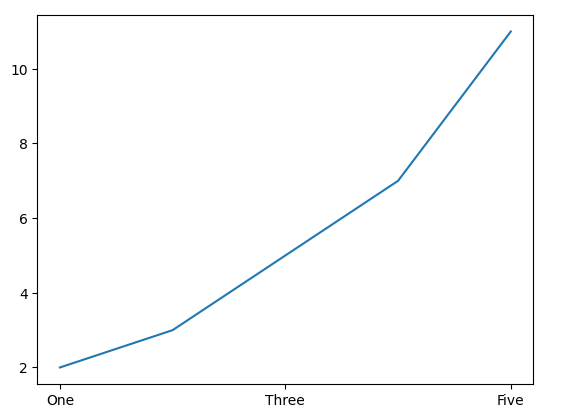
x = [1, 2, 3, 4, 5] y = [2, 3, 5, 7, 11]
plt.plot(x, y)
Set custom ticks and labels
plt.xticks([1, 3, 5], ['One', 'Three', 'Five'])
plt.show()
`
**Output:
Output
**Explanation:
- We can define specific tick positions and corresponding labels for the x-axis.
- The x-axis will have ticks at positions 1, 3, and 5.
- The labels will be "One", "Three", and "Five" corresponding to these positions.
Syntax
matplotlib.pyplot.xticks(ticks=None, labels=None, **kwargs)
**Parameters:
- **ticks: A list or array of positions where you want the ticks to appear on the x-axis. If not provided, it will return the current positions of the ticks.
- **labels: A list or array of labels corresponding to each tick position. These labels will be displayed at the tick positions. If not provided, the function will use the default numerical labels.
- ****kwargs: Additional keyword arguments, such as font size, color, rotation, etc., to customize the appearance of the ticks.
**Return Value:
The function returns the **current x-axis tick positions and **labels.
Examples of Matplotlib.pyplot.xticks()
**1. Customizing X-axis Tick Labels with Rotation and Adjusting Margins
Python `
import numpy as np import matplotlib.pyplot as plt
x = [1, 2, 3, 4] y = [95, 38, 54, 35] labels = ['Geeks1', 'Geeks2', 'Geeks3', 'Geeks4']
plt.plot(x, y)
You can specify a rotation for the tick labels in degrees or with keywords.
plt.xticks(x, labels, rotation ='vertical')
Pad margins so that markers don't get clipped by the axes
plt.margins(0.2)
Tweak spacing to prevent clipping of tick-labels
plt.subplots_adjust(bottom = 0.15) plt.show()
`
**Output:

**Explanation: This code creates a plot with custom x-axis labels (Geeks1, Geeks2, etc.), rotates them vertically, and adjusts margins to avoid clipping of tick labels. plt.subplots_adjust() ensures the labels fit within the plot.
**2. Using Matplotlib.pyplot.xticks() with Zoomed-In Inset Plot
Python `
import matplotlib.pyplot as plt
from mpl_toolkits.axes_grid1.inset_locator import inset_axes, zoomed_inset_axes
def get_demo_image(): from matplotlib.cbook import get_sample_data import numpy as np f = get_sample_data("axes_grid / bivariate_normal.npy", asfileobj = False) z = np.load(f)
# z is a numpy array of 15x15
return z, (3, 19, 4, 13)
fig, ax = plt.subplots(figsize =[5, 4])
Z, extent = get_demo_image()
ax.set(aspect = 1, xlim =(0, 65), ylim =(0, 50))
axins = zoomed_inset_axes(ax, zoom = 2, loc ='upper right')
im = axins.imshow(Z, extent = extent, interpolation ="nearest", origin ="upper")
plt.xlabel('X-axis') plt.ylabel('Y-axis')
plt.xticks(visible = False) plt.show()
`
**Output:

**Explanation: This code creates a main plot with a zoomed-in inset using zoomed_inset_axes. The get_demo_image() function loads a sample 15x15 data array, which is displayed in both the main plot and the inset. The inset plot zooms in on a specific portion of the main plot.