Matplotlib.ticker.LogFormatter Class in Python (original) (raw)
Last Updated : 21 Apr, 2020
Matplotlib is an amazing visualization library in Python for 2D plots of arrays. Matplotlib is a multi-platform data visualization library built on NumPy arrays and designed to work with the broader SciPy stack.
matplotlib.ticker.LogFormatter
The matplotlib.ticker.LogFormatter class is used for formatting ticks on a log or symlog scale. It is either instantiated directly or is subclassed.
Syntax: class matplotlib.ticker.LogFormatter(base=10.0, labelOnlyBase=False, minor_thresholds=None, linthresh=None)
Parameters:
- base: It is an optional float value for the logarithmic base used for all calculations. By default it is 10.
- labelOnlyBase: It is an optional boolean value which if set to True, the label ticks only at integer powers of base. In general it is True for major ticks and False for minor ticks. By default it is False.
- minor_thresholds: It is an optional tuple of two values(ie, subset, all).If labelOnlyBase is set to False, these two numbers dictate the labeling of ticks which are not at integer powers of the base; generally these are the minor ticks. The log of the axis data range is the controlling parameter.
- linthresh: This parameter must be supplied if a symmetric log scale is being used.
Methods of the class:
- format_data(self, value): It returns a position unspecified full string representation of the value.
- format_data_short(self, value): It returns a short format string representation of a number.
- label_minor(self, labelOnlyBase): it is used for switching on or off of minor tick labeling.
- set_locs(self, locs=None): It controls the labelling of ticks using axis view.
Example 1:
import numpy as np
import matplotlib.pyplot as plt
from matplotlib.ticker import LogFormatterSciNotation
class CustomTicker(LogFormatterSciNotation):
`` def __call__( self , x, pos = None ):
`` if x not in [ 0.1 , 1 , 10 ]:
`` return LogFormatterSciNotation.__call__( self , x, pos = None )
`` else :
`` return "{x:g}" . format (x = x)
fig = plt.figure(figsize = [ 7 , 7 ])
ax = fig.add_subplot( 111 )
ax.set_yscale( 'log' )
ax.set_xscale( 'log' )
ax.plot(np.logspace( - 4 , 4 ), np.logspace( - 4 , 4 ))
ax.xaxis.set_major_formatter(CustomTicker())
plt.show()
Output: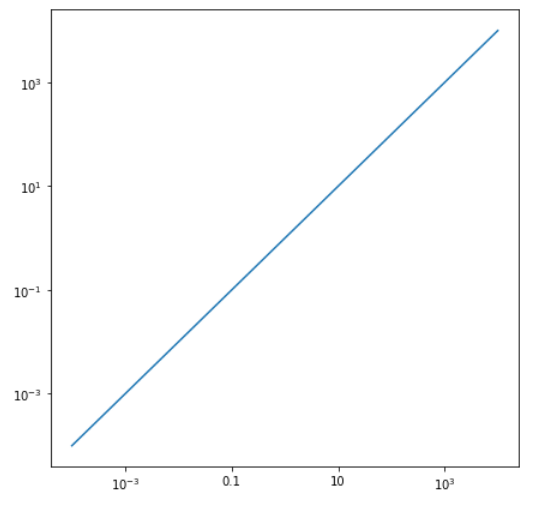
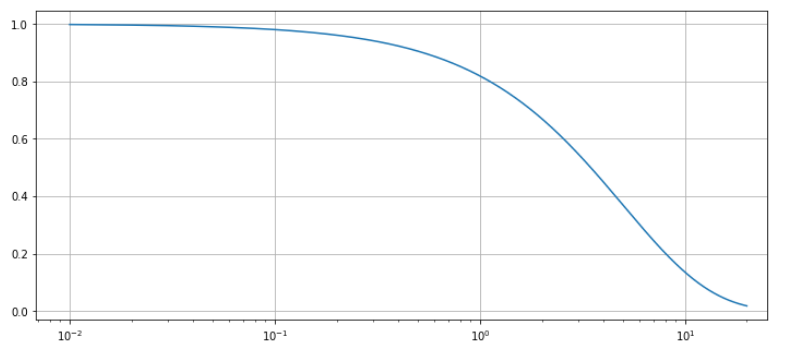
Example 2:
import matplotlib.pyplot as plt
from matplotlib.ticker import LogFormatter
import numpy as np
fig, axes = plt.subplots( 4 , figsize = ( 12 , 24 ))
dt = 0.01
t = np.arange(dt, 20.0 , dt)
axes[ 0 ].semilogx(t, np.exp( - t / 5.0 ))
axes[ 0 ].set_xlim([ 0 , 25 ])
axes[ 0 ].grid()
xlims = [[ 0 , 25 ], [ 0.2 , 8 ], [ 0.6 , 0.9 ]]
for ax, xlim in zip (axes[ 1 :], xlims):
`` ax.semilogx(t, np.exp( - t / 5.0 ))
`` formatter = LogFormatter(labelOnlyBase = False ,
`` minor_thresholds = ( 2 , 0.4 ))
`` ax.get_xaxis().set_minor_formatter(formatter)
`` ax.set_xlim(xlim)
`` ax.grid()
plt.show()
Output: