numpy.geomspace() in Python (original) (raw)
Last Updated : 31 May, 2021
numpy.geomspace() is used to return numbers spaced evenly on a log scale (a geometric progression).
This is similar to numpy.logspace() but with endpoints specified directly. Each output sample is a constant multiple of the previous.
Syntax : numpy.geomspace(start, stop, num=50, endpoint=True, dtype=None)
Parameters :
start : [scalar] The starting value of the sequence.
stop : [scalar] The final value of the sequence, unless endpoint is False. In that case, num + 1 values are spaced over the interval in log-space, of which all but the last (a sequence of length num) are returned.
num : [integer, optional] Number of samples to generate. Default is 50.
endpoint : [boolean, optional] If true, stop is the last sample. Otherwise, it is not included. Default is True.
dtype : [dtype] The type of the output array. If dtype is not given, infer the data type from the other input arguments.
Return :
samples : [ndarray] num samples, equally spaced on a log scale.
Code #1 : Working
Python
import numpy as geek
print ( "B\n" , geek.geomspace( 2.0 , 3.0 , num = 5 ), "\n" )
point = geek.geomspace( 1 , 2 , 10 )
print ( "A\n" , geek.sin(point))
Output :
B [ 2. 2.21336384 2.44948974 2.71080601 3. ]
A [ 0.84147098 0.88198596 0.91939085 0.95206619 0.9780296 0.9948976 0.99986214 0.98969411 0.96079161 0.90929743]
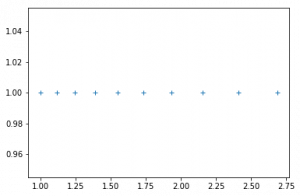
Code #2 : Graphical Representation of numpy.geomspace()
Python
import numpy as geek
import pylab as p
% matplotlib inline
x1 = geek.geomspace( 1 , 3 , 10 , endpoint = False )
y1 = geek.ones( 10 )
p.plot(x1, y1, '+' )
Output :
Similar Reads
- numpy.logspace() in Python The numpy.logspace() function returns number spaces evenly w.r.t interval on a log scale. Syntax : numpy.logspace(start, stop, num = 50, endpoint = True, base = 10.0, dtype = None) Parameters : -> start : [float] start(base ** start) of interval range. -> stop : [float] end(base ** stop) of in 2 min read
- NumPy Array in Python NumPy (Numerical Python) is a powerful library for numerical computations in Python. It is commonly referred to multidimensional container that holds the same data type. It is the core data structure of the NumPy library and is optimized for numerical and scientific computation in Python. Table of C 2 min read
- numpy.atleast_3d() in Python numpy.atleast_3d() function is used when we want to Convert inputs to arrays with at least three dimension. Scalar, 1 and 2 dimensional inputs are converted to 3-dimensional arrays, whilst higher-dimensional inputs are preserved. Input includes scalar, lists, lists of tuples, tuples, tuples of tuple 2 min read
- numpy.atleast_2d() in Python numpy.atleast_2d() function is used when we want to Convert inputs to arrays with at least two dimension. Scalar and 1-dimensional inputs are converted to 2-dimensional arrays, whilst higher-dimensional inputs are preserved. Syntax : numpy.atleast_2d(*arrays) Parameters : arrays1, arrays2, ... : [ar 2 min read
- numpy.fromiter() function – Python NumPy's fromiter() function is a handy tool for creating a NumPy array from an iterable object. This iterable can be any Python object that provides elements one at a time. The function is especially useful when you need to convert data from a custom data source, like a file or generator, into a Num 2 min read
- Python | Numpy np.coords() method With the help of np.coords() method, we can get the coordinates of a next value in iteration using np.coords() method. Syntax : np.coords() Return : Return the coordinates of next iterator. Example #1 : In this example we can see that by using np.coords() method, we are able to get the coordinates o 1 min read
- numpy.tile() in Python The numpy.tile() function constructs a new array by repeating array - 'arr', the number of times we want to repeat as per repetitions. The resulted array will have dimensions max(arr.ndim, repetitions) where, repetitions is the length of repetitions. If arr.ndim > repetitions, reps is promoted to 3 min read
- numpy.frombuffer() function – Python numpy.frombuffer() function interpret a buffer as a 1-dimensional array. Syntax : numpy.frombuffer(buffer, dtype = float, count = -1, offset = 0) Parameters : buffer : [buffer_like] An object that exposes the buffer interface. dtype : [data-type, optional] Data-type of the returned array, default da 1 min read
- numpy.byte_bounds() function – Python numpy.byte_bounds() function returns pointers to the end-points of an array. Syntax : numpy.byte_bounds(arr) Parameters : arr : [ndarray] Input array. Return : [tuple of 2 integers] The first integer is the first byte of the array, the second integer is just past the last byte of the array. If arr i 1 min read
- Python NumPy Numpy is a general-purpose array-processing package. It provides a high-performance multidimensional array object, and tools for working with these arrays. It is the fundamental package for scientific computing with Python. Besides its obvious scientific uses, Numpy can also be used as an efficient 6 min read