ChiSquare Distribution in NumPy (original) (raw)
Chi-Square Distribution in NumPy
Last Updated : 22 Apr, 2025
The **Chi-Square Distribution is used in statistics when we add up the squares of independent random numbers that follow a standard normal distribution. It is used in hypothesis testing to check whether observed data fits a particular distribution or not. In Python you can use the numpy.random.chisquare() function to generate random numbers that follow Chi-Square Distribution.
**Syntax: numpy.random.chisquare(df, size=None)
- **df: Degrees of freedom (denoted by k) which affects the shape of the distribution.
- **size: The number of random numbers you want to generate or the shape of the returned array.
Example 1: Generate a Single Random Number
To generate a single random number from a Chi-Square Distribution with __df_=2 (degrees of freedom):
Python `
import numpy as np
random_number = np.random.chisquare(df=2) print(random_number)
`
**Output :
4.416454073420925
Example 2: Generate an Array of Random Numbers
To generate multiple random numbers:
Python `
random_numbers = np.random.chisquare(df=2, size=5) print(random_numbers)
`
**Output :
[0.66656494 3.55985755 1.78678662 1.53405371 4.61716372]
Visualizing the Chi-Square Distribution
Visualizing the generated numbers helps to understand the behavior of the Chi-Square distribution. You can plot a histogram or a density plot using libraries like Matplotlib and Seaborn.
Python `
import numpy as np import matplotlib.pyplot as plt import seaborn as sns
df = 1
size = 1000
data = np.random.chisquare(df=df, size=size)
sns.displot(data, kind="kde", color='purple', label=f'Chi-Square (df={df})')
plt.title(f"Chi-Square Distribution (df={df})") plt.xlabel("Value") plt.ylabel("Density") plt.legend() plt.grid(True)
plt.show()
`
**Output:
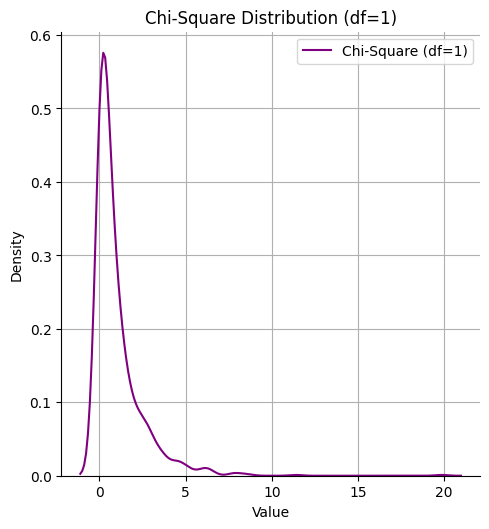
Chi-Square Distribution
The above chart shows the **shape of the Chi-Square distribution for df = 1:
- The **x-axis represents the values generated.
- The **y-axis shows the **density (how often values occur).
- With
df = 1the curve is **skewed to the right meaning lower values occur more frequently and higher values become rarer.