Uniform Distribution in NumPy (original) (raw)
Last Updated : 22 Apr, 2025
A Uniform Distribution is used when all the numbers in a range have the same chance of being picked. **For example, if we choose a number between 10 and 20 and every number in that range is just as likely as any other. In Python’s **NumPylibrary you can generate random numbers following a Uniform Distribution using the numpy.random.uniform() method. The syntax is:
**Syntax: numpy.random.uniform(low=0.0, high=1.0, size=None)
- **low : The lower bound of the range (inclusive). Default is
0.0. - **high : The upper bound of the range (exclusive). Default is
1.0. - **size : The shape of the returned array.
Example 1: Generate a Single Random Number
In this example we can see how to generate a single random number from a default Uniform Distribution (low=0, high=1):
Python `
import numpy as np
random_number = np.random.uniform() print(random_number)
`
**Output:
0.1466964230422637
**To generate multiple random numbers:
Python `
random_numbers = np.random.uniform(size=5) print(random_numbers)
`
**Output:
[0.72798597 0.35286575 0.10228773 0.56598948 0.03552713]
Visualizing the Uniform Distribution
Visualizing the generated numbers helps in understanding their behavior. Let’s see a example to plot a histogram of random numbers using numpy.random.uniform function.
Python `
import numpy as np import matplotlib.pyplot as plt import seaborn as sns
low = 10
high = 20
size = 1000
data = np.random.uniform(low=low, high=high, size=size) sns.histplot(data, bins=30, kde=False, color='skyblue', edgecolor='black')
plt.title(f"Uniform Distribution (Range: {low} to {high})") plt.xlabel("Value") plt.ylabel("Frequency") plt.grid(True) plt.show()
`
**Output:
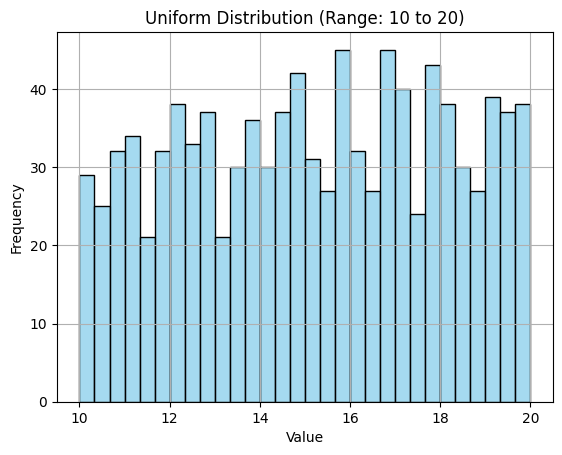
Uniform Distribution
The image above shows a **Uniform Distribution between 10 and 20. This means every number in that range is equally likely to happen. The bars in the histogram show that the values from 10 to 20 appear about the same number of times.