OLAP Operations in DBMS (original) (raw)
Last Updated : 3 Nov, 2025
OLAP (Online Analytical Processing) is a software technology that enables users to analyze data from multiple database systems simultaneously. It is based on a multidimensional data model, where data is represented in the form of cubes, also known as hyper-cubes. Each cube consists of dimensions (e.g., Location, Time, Product) and measures (e.g., Sales, Profit).
OLAP Operations
**Note: OLAP is widely used in data warehousing and business intelligence systems to support analytical queries, trend analysis, and decision-making.
Key OLAP Operations
OLAP supports five fundamental analytical operations that allow users to view data from different perspectives and levels of detail:
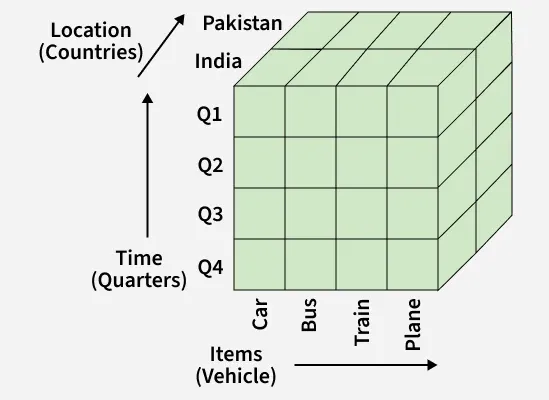
1. Drill Down
Drill Down
- The Drill Down operation provides a more detailed view of the data.
- It moves from a summary level to a lower level in the concept hierarchy (for example, from Year -> Quarter -> Month).
- **How it works: Moving down in the hierarchy & adding new dimensions for more granularity.
**Example: Viewing sales data for 2024 -> Q1 -> January instead of only yearly totals.
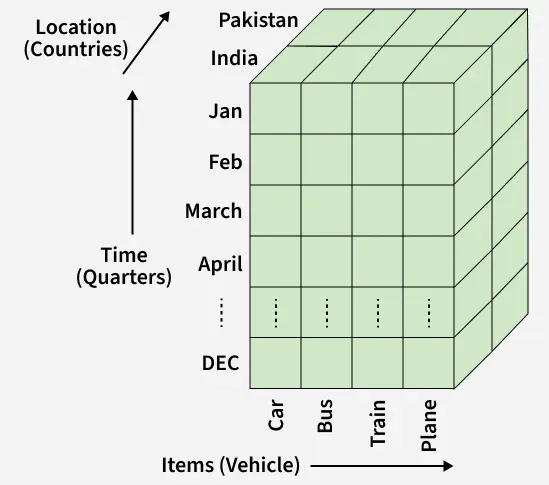
2. Roll Up

Roll Up
- The Roll Up operation is the opposite of Drill Down.
- It aggregates or summarizes data to provide a higher-level overview.
- **How it works: Climbing up in the concept hierarchy & reducing the number of dimensions.
**Example: Aggregating sales data from City -> Country or from Month -> Quarter.
3. Slice
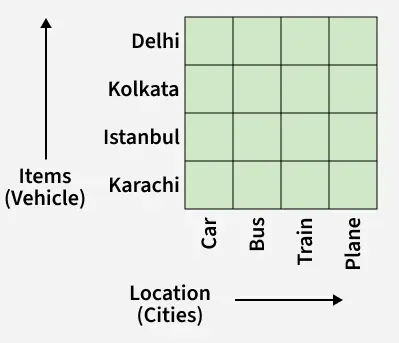
Slice
- The Slice operation selects a single dimension from the cube, creating a new sub-cube with reduced dimensionality.
- It helps focus on a specific data slice for analysis.
**Example: Selecting Time = "Q1" to analyze sales across all products and regions for the first quarter.
4. Dice
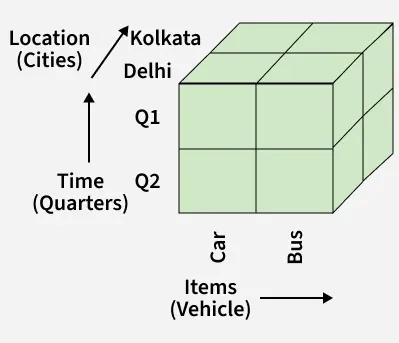
Dice
- The Dice operation selects data from the cube by applying filters on two or more dimensions to form a sub-cube.
- This results in a smaller cube focused on these specific dimensions.
**Example: Selecting: Location = "Delhi" or "Kolkata", Time = "Q1" or "Q2" & Item = "Car" or "Bus"
5. Pivot (Rotation)
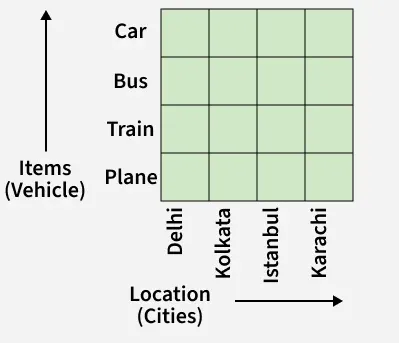
Pivot (Rotation)
- The Pivot operation (also known as Rotation) reorients the cube to provide a different view of the data.
- It helps users visualize data from different perspectives by rotating rows and columns.
**Example: Swapping the Time and Location axes to compare sales by quarter across different regions.