Round Robin Scheduling in Operating System (original) (raw)
Last Updated : 6 Jan, 2026
Round Robin Scheduling is a method used by operating systems to manage the execution time of multiple processes that are competing for CPU attention. It is called "round robin" because the system rotates through all the processes, allocating each of them a fixed time slice or "quantum", regardless of their priority.
The primary goal of this scheduling method is to ensure that all processes are given an equal opportunity to execute, promoting fairness among tasks.
- **Process Arrival: Processes enter the system and are placed in a queue.
- **Time Allocation: Each process is given a certain amount of CPU time, called a quantum.
- **Execution: The process uses the CPU for the allocated time.
- **Rotation: If the process completes within the time, it leaves the system. If not, it goes back to the end of the queue.
- **Repeat: The CPU continues to cycle through the queue until all processes are completed.
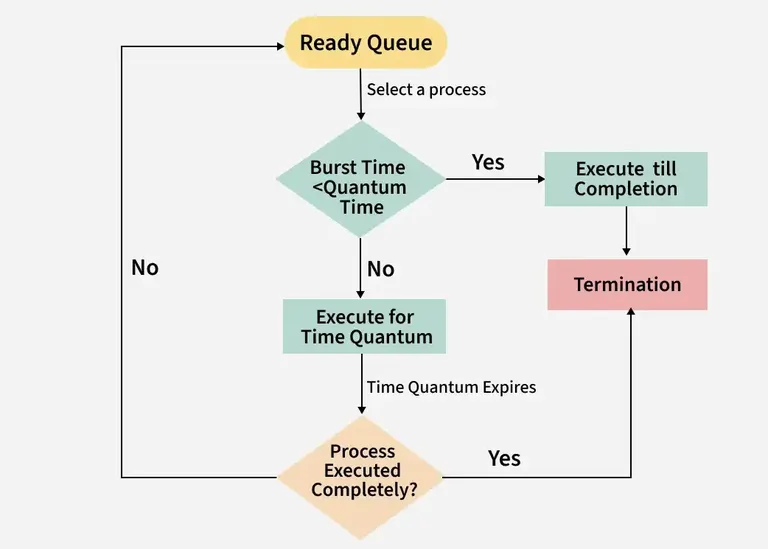
Round Robin Flow Chart
Example:
To understand the Round Robin Scheduling algorithm, let’s consider the following two scenarios:
Scenario 1: Processes with Same Arrival Time
Consider the following table of arrival time and burst time for three processes P1, P2 and P3 and given **Time Quantum = 2 ms
| **Process | **Burst Time | **Arrival Time |
|---|---|---|
| P1 | 4 ms | 0 ms |
| P2 | 5 ms | 0 ms |
| P3 | 3 ms | 0 ms |
**Step-by-Step Execution:
- **Time 0-2 (P1): P1 runs for 2 ms (total time left: 2 ms).
- **Time 2-4 (P2): P2 runs for 2 ms (total time left: 3 ms).
- **Time 4-6 (P3): P3 runs for 2 ms (total time left: 1 ms).
- **Time 6-8 (P1): P1 finishes its last 2 ms.
- **Time 8-10 (P2): P2 runs for another 2 ms (total time left: 1 ms).
- **Time 10-11 (P3): P3 finishes its last 1 ms.
- **Time 11-12 (P2): P2 finishes its last 1 ms.
Gantt Chart:
Now, lets calculate average waiting time and turn around time:
- **Turnaround Time = Completion Time - Arrival Time
- **Waiting Time = Turnaround Time - Burst Time
| Processes | AT | BT | CT | TAT | WT |
|---|---|---|---|---|---|
| P1 | 0 | 4 | 8 | 8-0 = 8 | 8-4 = 4 |
| P2 | 0 | 5 | 12 | 12-0 = 12 | 12-5 = 7 |
| P3 | 0 | 3 | 11 | 11-0 = 11 | 11-3 = 8 |
- **Average Turn around time = (8 + 12 + 11)/3 = 31/3 = 10.33 ms
- **Average waiting time = (4 + 7 + 8)/3 = 19/3 = 6.33 ms
Scenario 2: Processes with Different Arrival Times
Consider the following table of arrival time and burst time for three processes P1, P2 and P3 and given **Time Quantum = 2
| **Process | **Burst Time (BT) | **Arrival Time (AT) |
|---|---|---|
| P1 | 5 ms | 0 ms |
| P2 | 2 ms | 4 ms |
| P3 | 4 ms | 5 ms |
Step-by-Step Execution:
**1. Time 0-2 (P1 Executes):
- P1 starts execution as it arrives at 0 ms.
- Runs for 2 ms; remaining burst time = 5 - 2 = 3 ms.
- **Ready Queue: [P1].
**2. Time 2-4 (P1 Executes Again):
- P1 continues execution since no other process has arrived yet.
- Runs for 2 ms; remaining burst time = 3 - 2 = 1 ms.
- P2 arrive at 4 ms.
- **Ready Queue: [P2, P1].
**3. Time 4-6 (P2 Executes):
- P2 starts execution as it arrives at 4 ms.
- Runs for 2 ms; remaining burst time = 2 - 2 = 0 ms.
- P3 arrive at 5ms
- **Ready Queue: [P1, P3].
**4. Time 6-7 (P1 Executes):
- P1 starts execution.
- Runs for 1 ms; remaining burst time = 1 - 1 = 0 ms.
- **Ready Queue: [P3].
**5. Time 7-9 (P3 Executes):
- P3 starts execution.
- Remaining burst time = 4 - 2 = 2 ms.
- **Ready Queue: [P3].
**6. Time 9-11 (P3 Executes Again):
- P3 resumes execution and runs for 2 ms and complete its execution
- Remaining burst time = 2 - 2 = 0 ms.
- **Ready Queue: [].
**Gantt Chart:
Now, lets calculate average waiting time and turn around time:
| **Process | **Completion Time (CT) | **Turnaround Time (TAT = CT - AT) | **Waiting Time (WT = TAT - BT) |
|---|---|---|---|
| P1 | 7 ms | 7 ms | 2 ms |
| P2 | 6 ms | 2 ms | 0 ms |
| P3 | 11 ms | 6 ms | 2 ms |
- **Average Turn around time =7+2+6/3=15/3=5ms
- **Average waiting time = 2+0+2/3=1.33ms
Code Implementation:
Advantages of Round Robin Scheduling
- **Fairness: Each process gets an equal share of the CPU.
- **Simplicity: The algorithm is straightforward and easy to implement.
- **Responsiveness: Round Robin can handle multiple processes without significant delays, making it ideal for time-sharing systems.
Disadvantages of Round Robin Scheduling:
- **Overhead: Switching between processes can lead to high overhead, especially if the quantum is too small.
- **Underutilization: If the quantum is too large, it can cause the CPU to feel unresponsive as it waits for a process to finish its time.