pandas.crosstab() function in Python (original) (raw)
Last Updated : 03 Apr, 2025
**pandas.crosstab() function in Python is used to compute a cross-tabulation (contingency table) of two or more categorical variables. By default, computes a frequency table of the factors unless an array of values and an aggregation function are passed. It also supports aggregation when additional data and a custom function are provided. This function is ideal for summarizing relationships between categories and analyzing patterns in datasets efficiently. Example:
Python `
import pandas as pd
a = { 'Gender': ['Male', 'Female', 'Female', 'Male', 'Female', 'Male'], 'Product': ['A', 'B', 'A', 'A', 'C', 'B'] }
df = pd.DataFrame(a)
Generate crosstab
res = pd.crosstab(df['Gender'], df['Product'])
print(res)
`
**Output
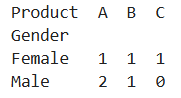
Output
**Explanation:
- The function returns a DataFrame where the rows represent the unique values from the index (Gender), and the columns represent the unique values from the columns (Product).
- The values in the DataFrame show the count of occurrences for each combination of gender and product.
**Syntax
pandas.crosstab(index, columns, values=None, rownames=None, colnames=None, aggfunc=None, margins=False, margins_name='All', dropna=True, normalize=False)
**Parameters:
- **index : array-like, Series, or list of arrays/Series, Values to group by in the rows.
- **columns : array-like, Series, or list of arrays/Series, Values to group by in the columns.
- **values : array-like, optional, array of values to aggregate according to the factors. Requires `aggfunc` be specified.
- **rownames : sequence, default None, If passed, must match number of row arrays passed.
- **colnames : sequence, default None, If passed, must match number of column arrays passed.
- **aggfunc : function, optional, If specified, requires `values` be specified as well.
- **margins : bool, default False, Add row/column margins (subtotals).
- **margins_name : str, default 'All', Name of the row/column that will contain the totals when margins is True.
- **dropna : bool, default True, Do not include columns whose entries are all NaN.
**Return Value: pandas.crosstab() function returns a DataFrame. This DataFrame contains the cross-tabulated data with the specified index and column values, as well as the aggregated values (if any). The resulting DataFrame shows the frequency counts (or other aggregate values) for each combination of the categories in the index and columns.
Examples of pandas.crosstab()
Example 1: Creating a Cross-tabulation with Multiple Columns Using pandas.crosstab()
In this code, we will use the pandas.crosstab() function to create a cross-tabulation of multiple categorical variables from numpy arrays. Specifically, we will analyze the relationship between three arrays a, b, and c by counting the occurrences of combinations of b and c for each value in a.
Python `
import pandas import numpy
a = numpy.array(["foo", "foo", "foo", "foo", "bar", "bar", "bar", "bar", "foo", "foo", "foo"], dtype=object)
b = numpy.array(["one", "one", "one", "two", "one", "one", "one", "two", "two", "two", "one"], dtype=object)
c = numpy.array(["dull", "dull", "shiny", "dull", "dull", "shiny", "shiny", "dull", "shiny", "shiny", "shiny"], dtype=object)
form the cross tab
pandas.crosstab(a, [b, c], rownames=['a'], colnames=['b', 'c'])
`
**Output

**Explanation:
- Three numpy arrays a, b, and c are created, each containing categorical data.
- **pandas.crosstab() function generates a contingency table where the rows are values from a and the columns are combinations of values from b and c.
- It outputs a DataFrame showing the frequency of each combination of b and c for every value of a.
Example 2: Creating a Crosstab with Categorical Data Using pandas.crosstab()
In this code, we will create two categorical variables using pandas.Categorical(). Then, we will generate a cross-tabulation of these two variables using pandas.crosstab(), first without including missing values and then with missing values included, to see how the dropna parameter affects the result.
Python `
import pandas
foo = pandas.Categorical(['a', 'b'], categories=['a', 'b', 'c'])
bar = pandas.Categorical(['d', 'e'], categories=['d', 'e', 'f'])
form crosstab with dropna=True (default)
pandas.crosstab(foo, bar)
form crosstab with dropna=False
pandas.crosstab(foo, bar, dropna=False)
`
**Output :

**Explanation:
- We create two categorical variables, foo and bar, with predefined categories using pandas.Categorical().
- **pandas.crosstab() function generates a contingency table, counting the occurrences of combinations of foo and bar.
- **dropna=True: Excludes any combinations with missing values (NaN).
- **dropna=False: Includes missing value combinations in the output.