Box plot visualization with Pandas and Seaborn (original) (raw)
Last Updated : 11 Jul, 2025
Box Plot is the visual representation of the depicting groups of numerical data through their quartiles. Boxplot is also used for detect the outlier in data set. It captures the summary of the data efficiently with a simple box and whiskers and allows us to compare easily across groups. Boxplot summarizes a sample data using 25th, 50th and 75th percentiles. These percentiles are also known as the lower quartile, median and upper quartile. A box plot consist of 5 things.
- Minimum
- First Quartile or 25%
- Median (Second Quartile) or 50%
- Third Quartile or 75%
- Maximum
To download the dataset used, click here.**Draw the box plot with Pandas:**One way to plot boxplot using pandas dataframe is to use boxplot() function that is part of pandas library.
Python3 `
import the required library
import numpy as np import pandas as pd import matplotlib.pyplot as plt % matplotlib inline
load the dataset
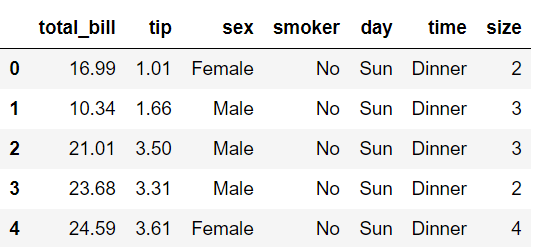
df = pd.read_csv("tips.csv")
display 5 rows of dataset
df.head()
`
 Boxplot of
 days with respect total_bill.
Python3 `
df.boxplot(by ='day', column =['total_bill'], grid = False)
`
 Boxplot of
 size with respect tip.
Python3 `
df.boxplot(by ='size', column =['tip'], grid = False)
`
 Draw the boxplot using seaborn library:
Syntax :
seaborn.boxplot(x=None, y=None, hue=None, data=None, order=None, hue_order=None, orient=None, color=None, palette=None, saturation=0.75, width=0.8, dodge=True, fliersize=5, linewidth=None, whis=1.5, notch=False, ax=None, **kwargs)Parameters: x = feature of datasety = feature of datasethue = feature of datasetdata = dataframe or full datasetcolor = color name
Let's see how to create the box plot through seaborn library. Information about "tips" dataset.
Python3 `
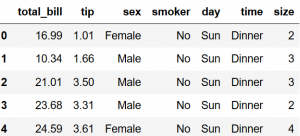
load the dataset
tips = sns.load_dataset('tips')
tips.head()
`
 Boxplot of
 days with respect total_bill.
Python3 `
Draw a vertical boxplot grouped
by a categorical variable:
sns.set_style("whitegrid")
sns.boxplot(x = 'day', y = 'total_bill', data = tips)
`

Let's take the first box plot i.e, blue box plot of the figure and understand these statistical things:
- Bottom black horizontal line of blue box plot is minimum value
- First black horizontal line of rectangle shape of blue box plot is First quartile or 25%
- Second black horizontal line of rectangle shape of blue box plot is Second quartile or 50% or median.
- Third black horizontal line of rectangle shape of blue box plot is third quartile or 75%
- Top black horizontal line of rectangle shape of blue box plot is maximum value.
- Small diamond shape of blue box plot is outlier data or erroneous data.